Customer pays with a mobile device while the cashier hands over a brown paper bag at a shop counter.

Should Your Shop Offer Buy Now, Pay Later in Kenya?

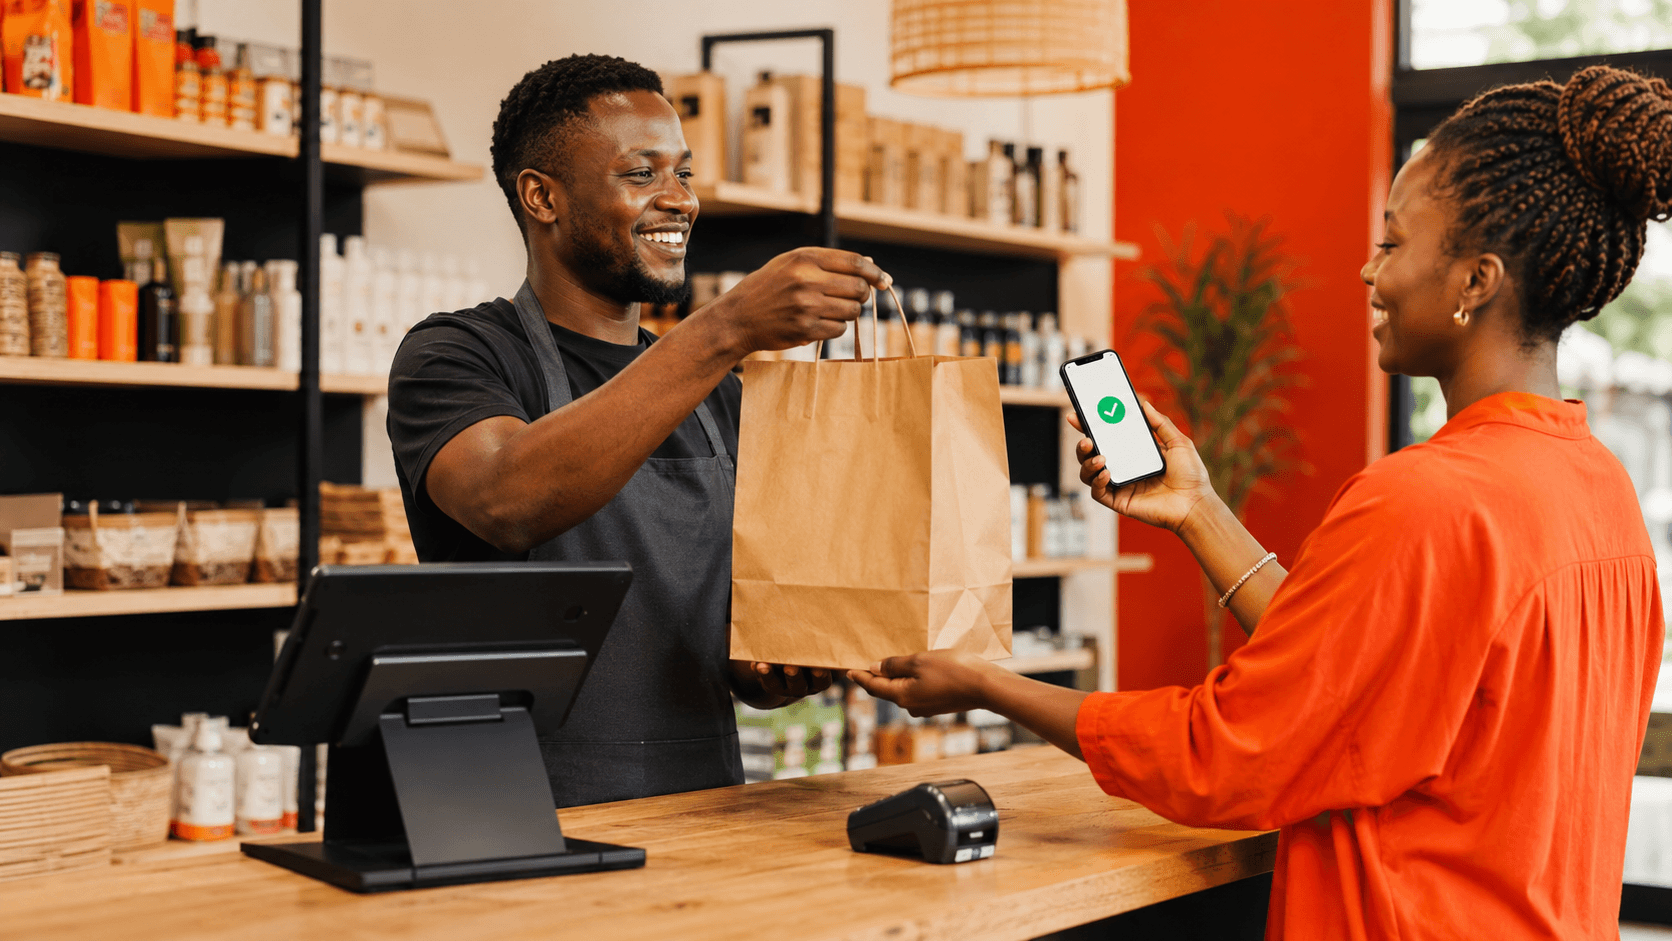
Buy Now, Pay Later is no longer a big-supermarket gimmick — it is quietly becoming the way many Kenyans shop. If you run a retail shop, a wines and spirits outlet, or a bar, the question isn’t whether your customers want to pay later. They already do.

Picture a customer in your wines and spirits shop on Thika Road, eyeing a KES 4,500 bottle three days before payday. Today they walk away empty-handed. With the right pay-later option, they walk away with the bottle — and you make the sale. Multiply that by the dozens of “I’ll come back end-month” moments you see every week, and you start to see why this matters.

Buy Now, Pay Later Is Booming in Kenya

BNPL has gone from niche to mainstream in just a few years. Kenya’s Buy Now, Pay Later market is on track to reach roughly USD 1.39 billion in 2026, growing close to 25% in a single year. That is not a fad — it is a shift in how people budget.

Your customers already know the names. Safaricom’s Faraja lets Lipa Na M-Pesa shoppers buy from as little as KES 20 up to KES 100,000 and settle within 30 days at zero interest to the customer. Lipa Later, Aspira, and M-KOPA have built whole businesses on letting people spread payments. The behaviour is everywhere — your shop is simply deciding whether to meet it.

  • It smooths the gap between paydays — a real pressure in an end-month, cash-tight economy.
  • It makes bigger purchases feel affordable, so basket sizes go up.
  • It rewards shops that say “yes” with loyalty and repeat visits.

Two Very Different Ways to “Pay Later”

Here is where most shop owners get confused. “Pay later” actually means two completely different things, and they carry completely different risks.

  • Third-party BNPL (Faraja, Lipa Later, Aspira): A licensed provider pays you in full — often immediately — then collects from the customer. The credit risk sits with them, not you. In return, you usually pay a facility or merchant fee on each sale.
  • Your own in-house credit — the famous “kuandika kwa kitabu”: You let a trusted customer take goods now and settle later, scribbled in an exercise book or a phone note. There is no fee, but every shilling of risk is yours. If they don’t pay, you lose both the stock and the cash.

Both are “Buy Now, Pay Later.” Only one of them protects your cash flow.

The Case For Saying “Yes” to Pay Later

Offered well, pay-later options can be one of the cheapest ways to grow sales. The upside is real:

  • Bigger baskets: Customers buy the crate instead of the six-pack when they can spread the cost.
  • More completed sales: You rescue the purchases that would otherwise walk out the door.
  • A reason to come back: A customer with an open, well-managed account has a real relationship with your shop.
  • Competing with the big guys: If the supermarket down the road offers it, matching that convenience keeps you in the race.

See How PawaPOS Tracks Every Customer Account

Whether it’s Faraja or your own book, the difference between a smart credit policy and a slow leak is record-keeping. PawaPOS gives you a live view of who owes what — so “pay later” never becomes “never paid.”

The Risks Most Shop Owners Don’t See Coming

Pay later is not free money. Before you say yes, look honestly at the costs.

  • The fee eats your margin. Third-party providers charge a facility or merchant fee on each sale. On thin-margin products, that fee can quietly turn a small profit into a loss if you haven’t priced for it.
  • Book credit becomes bad debt. That exercise book is where profits go to die. Forgotten balances, “but I already paid you” disputes, and customers who simply vanish are a daily reality for shops running informal credit.
  • You lose track of who owes what. When credit lives in someone’s head or a torn notebook, you cannot tell at a glance whether you are owed KES 5,000 or KES 50,000.
  • It hides your true stock position. Goods that left on credit but were never recorded look exactly like shrinkage at stocktake — so you end up chasing a “loss” that is actually money out on the street.

So, Should Your Shop Offer Buy Now, Pay Later?

There is no single answer — it depends on what you sell and how disciplined your records are. Use this as a quick guide:

  • High-value, low-frequency items (electronics, furniture, large liquor orders): Third-party BNPL is often worth it. Let the provider carry the credit risk and price the fee into your margin.
  • Fast-moving, low-margin goods (a duka, a bar selling single drinks): Be very cautious with informal credit. Fees and bad-debt risk rarely justify themselves on small tickets — keep your sales quick, clean, and cash or M-Pesa.
  • Trusted regulars and bulk buyers (a restaurant supplier, a corporate client): A formal, recorded credit account can deepen the relationship — but only with clear limits and a system that tracks every shilling.

The deciding factor isn’t whether pay-later is “good” or “bad.” It’s whether you can see, at any moment, exactly who owes you and how much.

Whichever Way You Go, Your Records Decide

Every successful pay-later strategy rests on one thing: clean, current records. This is exactly where most Kenyan shops lose money — not on the decision to offer credit, but on failing to track it. A cloud POS like PawaPOS turns “pay later” from a gamble into a managed part of your business.

You can set up customer accounts with credit limits, record every sale against the right customer, and watch outstanding balances in real time. Because the same system tracks your stock, goods that leave on credit are properly accounted for — so your stocktake finally matches reality.

  • Set credit limits per customer, so no one runs up a balance you can’t absorb.
  • See who owes what across all your branches — from your phone.
  • Reconcile credit sales against stock automatically, ending “phantom shrinkage.”
  • Pull a debtors report in seconds instead of squinting at a notebook.

Final Thoughts

Buy Now, Pay Later is here to stay, and for many Kenyan shops it is a genuine growth lever. But it only works when you can answer one question instantly: who owes me, and how much? Offered blindly, pay-later is just a polite way to give your stock away. Tracked properly, it grows your basket sizes and builds real loyalty.

Talk to us about setting up customer accounts and credit tracking in PawaPOS — before the next “I’ll pay you end-month” walks out your door.

Retail worker in a dim store uses a touchscreen POS tablet at the counter, with orange neon cloud data trails emanating from the screen.

Retail Data Backup in Kenya: Protect Sales, Stock, and Customers

Most Kenyan retail owners know their POS system is the heart of the business. But what happens when that heart stops — because the data it runs on simply disappears? Data backup for retail businesses is not a luxury. It is the difference between recovering from a crisis and shutting down permanently.

Picture this: It’s a busy Friday evening at your shop along Thika Road. Sales are flying, your POS is humming, stock is moving fast. Then — the lights go out. KPLC again. When power comes back an hour later, your POS system boots up with an error. Today’s 200-plus transactions? Gone. Your updated stock levels? Wiped. That supplier order you were finalising? Lost.

For thousands of Kenyan SME owners — in retail, bars, and restaurants — this is not a hypothetical. It is a Tuesday. And the retailers who survive it are the ones who had a data backup strategy in place before the disaster struck.

This week, we are talking about an unusual topic. Not sales. Not stock management. Not M-Pesa integration. We are talking about backups — and why ignoring this one discipline can undo everything else you have built in your business.

The Scale of the Problem — and Why Kenya Is Especially Exposed

Data loss is a global problem, but Kenyan businesses face a version of it that is uniquely challenging. While the rest of the world mostly worries about cyberattacks and software failures, Kenyan SMEs have all of that plus one of the world’s least predictable power grids.

Kenya Power reported over 1,200 outages in Nairobi alone in 2024 — some planned, most not. A small business in Westlands could lose 50 hours a year to blackouts, costing KES 100,000 in wasted wages and missed business.

Virtual Office Point, 2025

Now factor in that most small retail businesses in Kenya still run their POS on a local machine — a single computer, one hard drive, zero redundancy. When power surges, that machine is your single point of failure. When it dies, it takes everything with it: sales history, inventory counts, customer records, supplier pricing, and the audit trail your accountant needs at month-end.

One Nairobi CBD retailer experienced a stock system crash that wiped out an entire month of sales records. With no backup, recovery was not possible — the estimated loss was KES 200,000. That is not a tech problem. That is a business problem that started as a preparedness problem.

Globally, the numbers are equally sobering:

  • The most common cause of data loss is hardware failure — responsible for 44% of all incidents, followed by human error at 32%.
  • Small businesses lose an average of KES 180,000 (USD 1,410) per minute of system downtime.
  • Over 60% of small and mid-sized businesses that suffer severe data loss shut down within six months.
  • 93% of organisations that experience prolonged data loss lasting ten days or more go bankrupt within a year.

Read that last one again. Ninety-three percent. This is not about inconvenience. This is an existential business risk.

What Data Is Actually at Risk in a Retail Business?

When most shop owners hear “data backup,” they think of computer files — Word documents, Excel sheets. But for a retail business running a POS system, the data that really matters is far more specific and far more critical.

Data TypeWhat It ContainsImpact if Lost
Transaction RecordsEvery sale, payment method, cashier, timestampRevenue disputes, KRA compliance gaps, no end-of-day reconciliation
Inventory DataStock levels, product codes, reorder pointsInability to restock accurately, ghost inventory, supplier disputes
Customer RecordsCredit accounts, purchase history, loyalty dataLost credit balances, broken customer relationships
Pricing & Product CatalogueSKUs, prices, categories, barcode mappingsManual re-entry of hundreds of products — weeks of work
Financial ReportsDaily Z-reports, sales summaries, profit marginsBlind spots in business performance, accounting errors
Staff & Access LogsCashier sessions, discounts, voids, overridesNo accountability trail, theft investigations impossible

Each of these data types took years to build. Losing them does not just hurt operations for a day — it can set your business back by months, or erase it entirely. Re-entering an entire product catalogue after a hard drive crash can take three weeks and cost at least KES 80,000 in staff time alone — not counting lost sales while the system is down.

PawaPOS Stores Your Data Safely — Even When the Lights Go Out

Cloud-first architecture means your sales, stock, and reports are protected automatically. Want to see how it works for your business?

The 3-2-1 Backup Rule — The Gold Standard Your Business Needs to Know

If you take only one thing from this article, make it this: the 3-2-1 backup rule. Recognised by IT security professionals and cybersecurity bodies worldwide as the baseline standard for data protection, it is simple enough to remember and robust enough to protect you from almost every common data loss scenario.

Here is what the 3-2-1 rule means in plain terms:

  • 3 — Maintain three copies of your data. The original plus two backups. Redundancy is the point.
  • 2 — Store them on two different storage types. For example, a local hard drive AND cloud storage — not two USB drives sitting in the same drawer.
  • 1 — Keep one copy stored off-site. In the cloud or at another physical location. If your shop burns down, this copy survives.

For a Kenyan retail business, a practical 3-2-1 setup looks like this:

  • Copy 1 (Live): Your active POS database — the data your system is working with right now.
  • Copy 2 (Local backup): An automatic backup to a separate device in your shop — an external hard drive or a local server. This gives you fast recovery if just the main machine fails.
  • Copy 3 (Cloud backup): A second backup that pushes your data to a secure cloud server automatically — so that even if your shop is flooded, burned, or burglarised, your records survive and you can restore from any device with internet access.

💡 The Kenyan context: Local backups give you fast recovery when KPLC cuts the power and your machine crashes. Cloud backups protect you from the scenarios that local backups cannot — fire, theft, or a total hardware write-off after a power surge. You need both.

Why “The Computer Has Everything” Is the Most Dangerous Sentence in Retail

Walk into many small retail shops in Nairobi — whether in Eastleigh, Ngong Road, or River Road — and ask the owner where their sales data lives. The answer is almost always some version of: “It’s in the computer.”

That single computer is handling sales, managing inventory, running reports, and storing years of transaction history. It has no backup. No redundancy. No plan for when it stops working. And it will stop working — hard drives have a finite lifespan, power surges are frequent, theft happens, and ransomware attacks are increasingly targeting small businesses in Kenya.

Consider the full picture of what can go wrong:

  • Power surges: A single voltage spike from a KPLC fault can fry a motherboard and corrupt storage simultaneously — wiping data that even a professional data recovery specialist cannot retrieve.
  • Ransomware: Cybercriminals increasingly target SMEs because they know small businesses lack enterprise-grade security. If ransomware encrypts your POS database, you either pay the ransom or lose everything — unless you have a clean backup.
  • Staff errors: Accidental deletion, database corruption during an update, or a staff member running the wrong operation can destroy records just as effectively as any hardware fault.
  • Physical disasters: A small fire in a stockroom, a burst pipe, or even a break-in that results in stolen hardware can wipe your only copy of years of business data in minutes.

Is Your Business Data Protected Against All of These Risks?

PawaPOS is built cloud-first — your data is backed up automatically, without you needing to remember to do anything. Let us show you how.

Cloud vs. Local Backup — What Every Kenyan SME Should Know

The debate between local and cloud backup is not an either/or question. It is a both question. But understanding what each option protects you from — and what it does not — is essential for smart business decisions.

Local Backup

A local backup is a copy of your data stored on a device in your premises — an external hard drive, a USB drive, or a network-attached storage (NAS) device. The advantages are speed and accessibility: if your main machine fails, you can restore from a local backup within minutes without needing internet access. This is critical in areas with unreliable connectivity.

The weakness: local backups are physically co-located with your primary data. If the shop floods, burns, or is robbed, both copies disappear together.

Cloud Backup

A cloud backup stores a copy of your data on remote servers — in a data centre that may be in Nairobi, Johannesburg, or further afield. The advantages are geographic separation (a disaster at your premises cannot reach it), automatic scheduling (no one needs to remember to plug in a hard drive), and accessibility from any device anywhere.

For Kenyan SMEs, the main consideration is internet connectivity — cloud backup relies on a stable enough connection to push updates regularly. In areas with poor connectivity, the backup schedule may lag.

The Hybrid Approach — What We Recommend

The most resilient setup for a Kenyan retail SME combines both: a local backup for fast, on-site recovery from everyday incidents, and a cloud backup as the disaster-recovery layer for scenarios where local copies are compromised or physically destroyed. This is exactly the 3-2-1 principle in practice.

What a Good POS Backup System Should Do Automatically

A backup system worth its name should operate without manual intervention. If your staff have to remember to click “backup” before closing, the backup will eventually get missed. Automation is the only reliable backup. Here is what to look for:

  • Scheduled automatic backups — Your data should be backed up at regular intervals throughout the day, not just at closing time.
  • Incremental backups — Rather than copying the entire database every time, a good system copies only the changes since the last backup. Faster and more efficient.
  • Off-site cloud sync — Automatically push backups to the cloud after each session. This happens in the background without slowing down POS operations.
  • Easy restoration — A backup is only valuable if you can restore from it quickly. The process should not require an IT specialist.
  • Multi-branch support — Each branch should back up its data independently to the same centralised system, so head office always has a complete picture.
  • Backup verification — The system should confirm that backups completed successfully. A failed backup that no one notices is no backup at all.

How PawaPOS Approaches Data Backup and Business Continuity

PawaPOS is built cloud-first, which means the backup architecture is baked into the foundation — not bolted on as an afterthought. Every transaction processed through PawaPOS is stored in a cloud database that is geographically separated from your local hardware.

When the lights go out in your shop — and in Kenya, they will — your transaction history, inventory state, and customer records remain safe and accessible. When power comes back, your system restores to the last known state automatically. No manual intervention. No lost data. No weeks of re-entry work.

For businesses that want an additional layer of protection, the PawaPOS backup module supports scheduled local exports and optional cloud storage integration — giving you the full 3-2-1 architecture without needing a dedicated IT team to manage it.

Your data should survive anything that happens to your hardware. Because your hardware is replaceable. Your data is not.

🔗 Learn more about how PawaPOS manages your retail data: cosmopawa.com — or explore our retail operations blog for more practical guides for Kenyan SMEs.

Final Thoughts

Data backup is one of those topics that feels abstract — until the day you desperately need it and do not have it. By then, the conversation is no longer about cost or convenience. It is about survival.

For Kenyan retail businesses operating in an environment of frequent power outages, aging infrastructure, rising cybercrime, and fierce market competition, a backup strategy is not a luxury. It is as fundamental as having a lock on your front door.

The 3-2-1 rule gives you a framework. Cloud-first POS software removes the burden of manual management. And understanding exactly what data your retail business runs on — transactions, inventory, pricing, customer records — gives you the motivation to protect it properly.

Your biashara has taken years to build. Do not let a single power surge, a stolen laptop, or a software fault take it down in a day.

Talk to the PawaPOS team today — and let us show you how your business data can be protected, automatically, starting from day one.

Protect Your Retail Business Data With PawaPOS

Cloud-backed, automatic, and built for the realities of running a business in Kenya.

Infographic about understanding production costs in a Kenyan food factory, showing workers, packaging, and cost charts.

7 Proven Ways Kenyan Producers Slash Their Production Costs

If you manufacture or process goods, whether you run a bakery in Westlands, a juice factory along Thika Road, or a packaging business in Mombasa, your ability to price correctly and stay profitable starts with one thing: understanding your true production costs. Yet for most Kenyan SME manufacturers, production costing is either done on gut feel, a rough spreadsheet, or not at all. That gap between what things feel like they cost and what they actually cost is where margins disappear.

Kenya’s manufacturing sector is growing contributing 7.8% to GDP and generating over 352,000 direct jobs and SMEs are the engine powering that growth. But SMEs make up 98% of all businesses in Kenya while contributing only a fraction of total manufacturing output. One reason for that gap is operational businesses that can’t accurately cost their products can’t scale them. This guide breaks down production costing in plain language, with practical examples grounded in the Kenyan business context.

What Are Production Costs, and Why Do They Matter?

Production costs are every expense that goes into making a finished product from the raw ingredients you buy, to the electricity powering your machines, to the wages of the people on your production floor. Product costs are grouped into three core categories: direct materials, direct labour, and manufacturing overhead. Together, these three elements make up your total cost per unit the number that determines whether you’re pricing to profit or pricing to loss.

Here’s why this matters in the Kenyan context: rising input costs fuel, packaging, flour, cooking gas are squeezing margins across the food production and FMCG sectors. If you don’t know your exact production cost, you cannot respond to input price changes intelligently. You either absorb the loss silently or reprice blindly and risk losing customers.

The Three Pillars of Production Costing

1. Direct Materials — Your Bill of Materials (BOM)

Direct materials are the raw inputs that physically become part of your finished product. For a mandazi bakery, it’s flour, sugar, oil, and eggs. For a juice manufacturer, it’s fruit, water, preservatives, and bottles. A Bill of Materials (BOM) is essentially the recipe, a comprehensive list of all materials, quantities, and their associated costs required to produce one unit of your product.

Getting your BOM right is the foundation of everything else. Each ingredient needs to be recorded at the correct unit of measure (grams, litres, kilograms) and at the actual purchase cost, not an estimate. The quantity formula is straightforward:

Total Ingredient Qty = (Units per pack × Number of packs) + Loose/fractional quantity

For example: a recipe needs 500 g of wheat flour, but you buy flour in 50 kg bags. Your BOM records 500 g against the cost-per-gram derived from the 50 kg bag price. Consistency in unit conversions prevents the most common costing errors and in a production environment, small per-unit errors multiply fast across hundreds or thousands of units.

The total direct material cost is calculated as:

Direct Materials Cost = Beginning Raw Materials Inventory + Purchases − Ending Raw Materials Inventory

2. Direct Labour — The Human Cost of Production

Direct labour is the cost of staff who are physically involved in making the product the person mixing dough, operating the filling machine, or assembling goods on the line. Direct labour includes wages, benefits, and any payroll taxes directly attributable to production staff.

In a Kenyan SME setting, many production staff are casual workers paid on a daily or piece-rate basis — which can make labour costs variable and easy to overlook in costing models. The key is to calculate labour cost per production batch: how many labour-hours does one batch take, and what is the total wage cost for that time? That per-batch labour cost then divides across all units produced in the batch to give you a per-unit labour contribution.

3. Manufacturing Overheads — The Costs That Hide in Plain Sight

Overheads are where most Kenyan manufacturers get stuck. They’re real costs — but they don’t sit on a single product the way flour does. Manufacturing overhead includes all indirect production expenses not explicitly tied to specific products — equipment depreciation, rent, insurance, and utilities.

Overheads typically fall into three types:

  • Fixed overheads — costs that stay constant regardless of how much you produce. Kitchen rent, equipment lease payments, a permanent factory security guard. Whether you produce 100 units or 1,000, the rent is the same.
  • Variable overheads — costs that rise and fall with production volume. Electricity consumption for machinery, cooking gas, packaging materials. Variable overheads change with shifts in production volume — the more you produce, the higher these costs go.
  • Percentage-based overheads — overheads calculated as a percentage of total raw material cost. For example, a logistics allowance set at 3% of ingredient cost, or a wastage buffer of 2%.

Common overhead items for a Kenyan food producer or manufacturer include:

  • Electricity (KPLC bills — a significant and often unpredictable overhead)
  • Cooking gas or LPG
  • Water
  • Kitchen or factory rent
  • Equipment maintenance and repairs
  • Cleaning and sanitation supplies
  • Packaging materials not captured in the BOM
  • Kitchen staff wages for non-production roles (supervisors, cleaning crew)
  • Administrative costs allocated to the production centre

Overhead costs should be allocated based on the percentage of production time or space used for each product — so if you produce two product lines sharing one kitchen, you split overhead proportionally between them.

PawaPOS
Integrate. Automate. Optimize.
Take full control of your retail business today

From stock management to M-Pesa payments and real-time reports — PawaPOS is built for Kenyan businesses like yours.

The Full Production Cost Formula

Once you have all three components, the formula is straightforward:

Total Unit Cost = Direct Materials Cost + Direct Labour Cost + Manufacturing Overhead Cost

Let’s make this real. Say you run a small nut butter production line in Nairobi:

Cost ComponentDetailAmount (KES)
Direct materialsMacadamia nuts, oil, salt, jars, labels8,400
Direct labour2 workers × 4 hrs × KES 200/hr1,600
OverheadsElectricity, gas, cleaning, rent allocation1,200
Total batch cost80 jars produced11,200
Unit production costKES 11,200 ÷ 80 jarsKES 140 / jar

With KES 140 as your floor cost, you can confidently set a retail price that covers cost, allows for distribution margin, and leaves you with profit. Without this calculation, many business owners price at KES 150 “because it feels right” — not knowing whether they’re making KES 10 margin or running a KES 5 loss after overheads.

From Recipe to Stock: The Production Lifecycle in a Managed System

In an informal or spreadsheet-based operation, costing calculations are done once — at setup — and then drift out of date as input prices change. A proper production management system ties costing to live inventory data through a structured lifecycle:

  • Recipe / BOM Configuration — each finished good is configured with its ingredient list and overhead assignments. The system computes unit cost automatically: unit cost = sum of ingredient costs + sum of overhead costs.
  • Materials Requisition (MRQ) — before a production run, a materials requisition is raised. The system explodes the recipe and calculates exactly how much of each raw material is needed for the planned production quantity.
  • Approval — the requisition is reviewed and approved by an authorised person before raw materials are released — creating a control checkpoint that prevents unauthorised production.
  • Raw Material Issuance — approved materials are issued out of inventory to the production centre, reducing stock balances in real time.
  • Finished Goods Receipt — completed goods are received back into inventory, valued at the pre-computed unit cost (ingredients + overheads). The batch is closed.

This lifecycle closes the loop between production activity and inventory accuracy — so your stock reports reflect what’s actually in your warehouse, and your cost of goods sold is correctly computed rather than estimated.

Why Most Kenyan SME Producers Undercount Their Costs

There are predictable patterns in how production costs get undercounted. Recognising them is the first step to fixing them:

  • Overheads are not assigned to products. Electricity, gas, and rent are paid as business expenses but never allocated to individual products. The cost is real — it’s just invisible in the product price.
  • Ingredient quantities are approximated. When a recipe says “a handful of salt” or “about 2 kg of flour,” costing accuracy is gone. Precise grams and litres matter.
  • Wastage and yield loss is ignored. Raw material yields are rarely 100%. Peeling, trimming, evaporation, and spoilage reduce the amount of usable input. A 1 kg orange yields roughly 400–500 ml of juice — the cost of the wasted 50–60% of the fruit must still be costed into that juice.
  • Labour is treated as a fixed business cost, not a per-product cost. Staff wages are paid whether production runs or not — but they should still be allocated to what was produced during paid production hours.
  • Input prices are not updated after supplier price changes. Costing models built six months ago with old commodity prices are actively misleading.

Research on Kenyan manufacturing SMEs shows a positive correlation between adopting structured operational technology and improved production efficiency and competitiveness — confirming that the gap between informal and formalised production management is a performance gap, not just an administrative one.

Fixed vs. Variable Overheads: Why the Distinction Matters for Pricing

Understanding whether an overhead is fixed or variable changes how you use it in pricing decisions. Manufacturing overhead must be divided up and allocated to each unit produced — but the method of allocation differs by cost type.

Fixed overheads get cheaper per unit as you produce more. If your monthly kitchen rent is KES 30,000 and you produce 1,000 units, rent contributes KES 30 per unit. If you scale to 3,000 units, it drops to KES 10 per unit. This is why volume matters so much to production profitability — fixed costs spread over more units dramatically improves your margin per unit.

Variable overheads stay roughly constant per unit regardless of scale. Electricity per unit doesn’t drop just because you’re producing more — you’re still consuming proportionally the same power per unit of output.

This distinction matters for pricing decisions: if a customer wants a bulk order at a lower price, you can offer a discount on the fixed overhead portion — not on the variable materials and direct labour portion, which are irreducible.

How PawaPOS Handles Production Costing End-to-End

PawaPOS includes a built-in production management module designed for exactly the kind of businesses described in this article — Kenyan producers in food processing, beverages, packaging, and light manufacturing who need structured costing without the complexity of enterprise manufacturing software.

Here’s how the module works in practice:

  • Overhead Master — you define overhead types (Utilities, Labour, Packaging) and individual overhead items with their cost type: fixed amount, variable per-unit rate, or percentage of raw material cost. Pre-configured overhead templates include Electricity, Water, Gas, Kitchen Staff Wages, Kitchen Rent, Equipment Maintenance, Cleaning Supplies, and Packaging Materials.
  • Stock Catalog with Bill of Materials — each finished product is configured with a full ingredient list. Each ingredient line captures the raw material, quantity in the correct unit of measure, packing conversion ratios, and unit cost. The system computes line costs (excl. VAT and incl. VAT) automatically.
  • Computed Unit Cost — unit cost is automatically calculated as the sum of all ingredient costs plus all overhead costs. This becomes the valuation rate when finished goods are received back into inventory — ensuring your stock is always valued at true production cost.
  • Materials Requisition with Recipe Explosion — when you initiate a production run, PawaPOS explodes the recipe automatically across the planned quantity and generates a materials requisition with exact raw material requirements.
  • Approval Controls — production batches require approval before materials can be released, giving management a control checkpoint over production activity.
  • Raw Material Issuance & Finished Goods Receipt — raw materials are issued from stock (reducing inventory) and finished goods are received into stock (increasing inventory at computed unit cost) — keeping inventory balances accurate throughout the production cycle.

The result: your stock reports, cost of goods sold, and profitability figures all reflect actual production reality — not estimates. You can answer the question “what does it cost me to make this?” with a number, not a guess. Learn more on the CosmoPawa website or read our related guide on managing inventory shrinkage in Kenyan retail businesses.

Free consultation

Ready to see PawaPOS in action?

Chat with our team on WhatsApp — we’ll walk you through a live demo at your convenience.

Chat With Us on WhatsApp

Typically replies within minutes

Final Thoughts

Production costing is not an accounting exercise — it’s a survival skill for any Kenyan manufacturer. Knowing your true unit cost gives you the confidence to price correctly, negotiate with distributors, respond to input cost increases, and make volume decisions intelligently. Kenya’s manufacturing growth ambitions depend on SMEs becoming more operationally sophisticated — and costing discipline is where that sophistication begins.

Whether you’re running a single production line or managing multiple production centres across branches, the principle is the same: every cost that goes into making your product must be tracked, assigned, and computed — not guessed. The businesses that know their numbers are the ones that survive input price shocks, scale profitably, and build brands that last. Chat with us on WhatsApp at +254 710 901 965 to see how PawaPOS can bring this structure to your production operation.

How to Stop Losing Money at Checkout: The Hidden Costs Kenyan Retailers Miss

Every retailer knows the frustration: customers walk in, fill their baskets, then abandon their purchases at the checkout line. It’s a silent profit killer happening in retail stores across Kenya, costing businesses thousands of shillings daily, and most don’t even realize it’s happening.

Martha Mbugua, a retail operations leader, put it perfectly: “A customer can forgive an out-of-stock item. They rarely forgive a long checkout queue.” Yet many retailers still treat their checkout as an afterthought, focusing on merchandising while losing customers at the final, most crucial step.

The checkout isn’t just where transactions happen, it’s where customers decide if they’ll return. And right now, outdated systems are bleeding your profits in ways you might not see on your daily reports.

The Real Cost of Slow Checkouts

Picture this: It’s Saturday afternoon at your store. Five customers are waiting in line, each holding items worth KES 2,500. Your cashier is manually entering prices, the customer disputes an amount, the till drawer jams, and an M-Pesa payment needs manual confirmation.

By the time you look up, two customers have left, taking KES 5,000 in lost sales with them. And they probably won’t be back.

Fast checkout isn’t a luxury, it’s a competitive advantage. When your competitors can process a transaction in 30 seconds while yours takes 3 minutes, you’re not just losing sales. You’re losing customers to businesses that respect their time.

Modern POS systems like PawaPos eliminate these bottlenecks through:

  • Lightning-fast barcode scanning – No more manual price entry
  • Instant M-Pesa verification – Payments confirmed in seconds, not minutes
  • Multi-payment options – Cash, card, M-Pesa, all in one smooth flow
  • Automatic calculations – Zero pricing disputes or manual errors

The math is simple: If you process just 10 extra transactions per day because checkout is faster, at an average basket of KES 1,500, that’s KES 15,000 daily, KES 450,000 per month in recovered sales.

The Silent Thief: Retail Shrinkage

Here’s what keeps retail owners up at night: You’re making sales, inventory is moving, but your profits don’t match the math. The culprit? Retail shrinkage—and manual systems make it almost impossible to detect.

Shrinkage comes in three forms:

1. Customer Theft

Without proper tracking, shoplifters walk out with merchandise that never appears on your loss reports. You only notice when stock counts don’t match sales—often weeks or months later.

2. Employee Fraud

Manual tills create opportunity. A cashier undercharges a friend, pockets the difference, or voids legitimate transactions. With no digital trail, these losses are nearly invisible until they’ve cost you thousands.

3. Administrative Errors

Wrong prices entered, incorrect quantities recorded, missing receipts—small mistakes that add up to significant losses over time.

The Kenya reality: Studies show retail shrinkage typically costs businesses 1-3% of total sales. For a store doing KES 2 million monthly, that’s up to KES 60,000 disappearing every month.

Modern POS systems stop shrinkage by creating complete accountability:

  • Every item scanned – No manual price entry means no “friendly discounts”
  • Digital transaction trail – Every sale, void, and refund is timestamped and tracked
  • Real-time inventory sync – Stock levels update instantly, making discrepancies obvious
  • User-level permissions – Track exactly who processed which transactions
  • Automatic reconciliation – Cash drawer amounts match sales reports to the shilling

The impact? Retailers using modern POS systems typically reduce shrinkage by 40-60%, recovering tens of thousands in monthly losses.

The M-Pesa Verification Gap

If you’re still relying on customer SMS screenshots for M-Pesa payments, you’re leaving money on the table, and exposing yourself to fraud.

Here’s what’s happening in Kenyan retail right now:

The Old Way (Still Used by Many):

  1. Customer claims they’ve sent M-Pesa
  2. They show you an SMS screenshot
  3. You trust it and release the goods
  4. Later, you realize the payment never arrived

The Modern Way with PawaPos:

  1. Customer selects M-Pesa payment
  2. System sends STK push to customer’s phone
  3. Payment is verified in real-time through API
  4. Transaction only completes when payment is confirmed
  5. Instant receipt generated

No screenshots. No trust issues. No fraud. Just verified, instant payments.

What Checkout Excellence Actually Looks Like

“Efficient checkouts come from discipline, not urgency:
• Planning staffing around traffic patterns, not schedules
• Opening tills before queues form
• Clear front-end ownership during peak hours
• Leaders actively managing flow in real time”

— Martha Mbugua, Retail Operations Leader

She’s absolutely right—but here’s what she didn’t mention: Great operations need great technology.

This is where PawaPos gives Kenyan retailers the edge:

Sub-3-Second Transactions

From scan to receipt, the entire process is lightning-fast. No lag, no waiting, no frustrated customers.

📊

Real-Time Peak Hour Detection

The system shows you live traffic patterns, helping you decide when to open additional tills—before the queue forms.

💪

Offline-First Architecture

Kenya’s internet isn’t always reliable. PawaPos keeps working even when connectivity drops, syncing automatically when it’s restored.

📱

Mobile POS Option

During peak times, turn any Android device into an additional checkout point. Process sales from anywhere in your store.

The Real-World Impact: A Nairobi Case Study

Before PawaPos:

  • Average checkout time: 4.5 minutes
  • Shrinkage: KES 40,000/month
  • M-Pesa fraud: 2-3 incidents/month
  • Abandoned baskets: 15-20%
  • Monthly revenue: KES 2.2 million

After PawaPos:

  • Average checkout time: 45 seconds ✅
  • Shrinkage: KES 14,000/month ✅
  • M-Pesa fraud: Zero ✅
  • Abandoned baskets: Less than 5% ✅
  • Monthly revenue: KES 2.8 million ✅

27% revenue increase!

Stop the Bleeding: Take Action Today

The question isn’t whether you can afford a modern POS system—it’s whether you can afford to keep losing money without one.

Ready to stop losing money at checkout?


📧 Email: info@cosmopawa.com

🏢 Visit Us:
Cosmo House, Mawe Mbili Road
(off Kangundo Road), Nairobi

Business Hours:
Monday – Friday: 8:00 AM – 6:00 PM
Saturday: 9:00 AM – 2:00 PM EAT


PawaPos is proudly Kenyan, built specifically for East African retailers. We understand your challenges because we work with businesses just like yours every day, from small shops to supermarket chains across Nairobi, Mombasa, Kisumu, and beyond.

Proudly Local. Powerfully Retail.

5 Essential Business Numbers Your Kenyan Shop Needs Now

Not knowing your business numbers is the number one silent killer of Kenyan SMEs. You can run a busy shop on Thika Road, a packed bar in Westlands, or a restaurant with tables booked every Friday night — and still be losing money every single month. These five metrics are what separate businesses that thrive from businesses that are always scrambling to make payroll.

Q2 is here. April has started. And if you’re like most SME owners in Kenya, the last three months were spent doing exactly one thing: keeping the business alive. Serving customers, restocking shelves, chasing suppliers, managing staff, handling M-Pesa reconciliations at 10 PM. Busy, busy, busy.

But here’s the uncomfortable truth: being busy is not the same as being profitable.

Why Kenyan SMEs Struggle With Financial Visibility

According to the Kenya National Bureau of Statistics (KNBS), SMEs contribute approximately 33.8% of Kenya’s GDP and account for roughly 80% of total employment. Yet a significant number of those businesses close within their first few years — not because of competition, not because of the economy, but because the owner didn’t know their numbers until it was too late.

Financial visibility isn’t a luxury reserved for big corporates with finance departments. It’s the basic operational intelligence every wafanyabiashara needs — whether you’re running one outlet in Gikomba or three branches across Nairobi. And the good news: you only need to track five numbers to get started.

80% of SME employment in Kenya depends on businesses that often have no reliable system for tracking their own financial performance.

Kenya National Bureau of Statistics (KNBS)

The 5 Business Numbers You Must Know — Starting This Quarter

① Daily Sales Average (DSA)

This is the simplest number on this list — and the one most owners get wrong because they rely entirely on gut feel. Your Daily Sales Average (DSA) tells you exactly how much revenue your business generates on a typical day, removing the noise of a good Saturday or a slow Monday after a public holiday.

DSA = Total Monthly Revenue ÷ Number of Trading Days

Why does this matter in Q2? Because it gives you a concrete baseline to measure against. If your DSA drops two weeks in a row, something has changed — a competitor opened nearby, a key staff member isn’t performing, or a supplier issue is affecting your stock availability. Without the number, you won’t see it coming.

💡 PawaPOS tip: Your PawaPOS dashboard displays your daily sales trend automatically — including a comparison against the previous period. No spreadsheets, no manual calculations. You see the number the moment you open the app.

② Cost of Goods Sold (COGS)

Revenue is vanity. Profit is sanity. And you cannot calculate profit without knowing your Cost of Goods Sold. COGS tells you exactly how much it costs to produce or stock the products you sold in a given period.

COGS = Opening Stock + Purchases − Closing Stock

For a Nairobi bar or restaurant, this includes raw ingredients, beverages, and any consumables that go directly into what you serve. For a retail shop, it’s your purchase price for every item sold. If your COGS is creeping up and your revenue is flat, your margins are quietly being squeezed — and most owners don’t catch this until the damage is done.

💡 PawaPOS tip: PawaPOS tracks every sale and purchase in real time, so your COGS is calculated continuously — not just at month-end when it’s too late to act.

③ Gross Profit Margin

This is the most powerful number on this list. Gross Profit Margin tells you what percentage of every shilling of revenue you actually keep after covering the direct cost of your products. It’s the clearest measure of whether your pricing, purchasing, and product mix are working together.

Gross Margin % = ((Revenue − COGS) ÷ Revenue) × 100

Healthy gross margins vary by sector. A Nairobi supermarket might run at 18–25%. A restaurant can target 60–70% on food (before overheads). A bar with a strong house brand mix can push higher. The specific number matters less than knowing your number — and tracking whether it’s improving or eroding quarter by quarter.

“As SMEs look ahead to Q2, three imperatives emerge: protect cash flow by tightening receivables, managing inventory judiciously, and avoiding excessive debt.”

GoTyme Bank Business Banking Outlook, Q2 2026

④ Stock Turnover Rate

Dead stock is dead money. Every item sitting on your shelf that isn’t selling is cash you’ve already spent — cash that can’t pay rent, restock fast-moving items, or cover a surprise supplier invoice. Your Stock Turnover Rate shows you how efficiently you’re converting inventory into sales.

Stock Turnover = COGS ÷ Average Inventory Value

A higher turnover rate means your stock is moving quickly — you’re buying what sells. A low rate is a red flag: you may be over-ordering slow movers, or holding products that have quietly gone out of season while you were busy serving customers at the counter.

💡 PawaPOS tip: PawaPOS inventory alerts flag slow-moving stock before it becomes a write-off. You can set reorder levels per product and receive notifications when stock falls below your defined threshold — so you’re always stocking what sells, not what sits.

⑤ Average Transaction Value (ATV)

How much does the average customer spend per visit? This is your Average Transaction Value — and it’s one of the fastest levers you have to grow revenue without finding a single new customer.

ATV = Total Revenue ÷ Number of Transactions

If your ATV is KES 450 and you serve 80 customers a day, you’re generating KES 36,000 daily. Increasing ATV by just KES 50 — through a simple upsell, a bundled deal, or a well-placed impulse purchase at the counter — adds KES 4,000 per day without a single extra customer walking through the door. Over a month, that’s KES 100,000+ in additional revenue from one small change.

💡 PawaPOS tip: PawaPOS breaks down your transaction history by time of day, product category, and cashier — so you can spot exactly when and where upsell opportunities are being missed.


See Your Business Numbers in Real Time — Start Today

PawaPOS gives Kenyan SMEs a live dashboard with all five of these metrics tracked automatically — no Excel sheets, no end-of-month scrambles, no guessing. Whether you run a single shop or multiple branches, you’ll always know exactly where your business stands.


Why These Numbers Matter Even More in Q2 2026

This isn’t a normal Q2. Inflation has stabilised but input costs remain elevated for most retail and hospitality businesses across Kenya. Consumer spending is cautious. Credit is tighter. In this environment, the businesses that survive and grow won’t necessarily be the ones with the best products or the highest footfall — they’ll be the ones that make the best decisions with the data they have.

And you cannot make good decisions without good numbers.

Your April Action Plan: 3 Steps to Get Started This Week

  1. Pull your Q1 sales report and calculate your DSA, COGS, and Gross Margin for January, February, and March. Look for trends — not just totals.
  2. Identify your top 10 products by revenue and check their individual margins. You may find that your highest-selling product is also your lowest-margin one.
  3. Set a target for each of the 5 metrics for Q2 and review them weekly — not monthly. A week of bad numbers is recoverable. A quarter of ignored numbers is a crisis.

If you’re doing this manually right now, you already know how painful it is. PawaPOS was built specifically for Kenyan SMEs who are ready to stop guessing and start running their business on real data. See what PawaPOS can do for your business →

Final Thoughts

Five numbers. That’s all it takes to go from running your business on instinct to running it on intelligence. Your Daily Sales Average, Cost of Goods Sold, Gross Profit Margin, Stock Turnover Rate, and Average Transaction Value — tracked consistently, reviewed weekly, acted on quickly — are the difference between a business that grows and one that grinds.

Q2 has already started. The best time to get your numbers in order was January. The second-best time is today.

#image_title

How Cash Quietly Drains Profit from Kenyan Businesses

2%+

A small daily loss feels harmless until it compounds into hundreds of thousands over a year.

KSh 66K+

That is the kind of monthly cash drag many businesses absorb without ever tracking it properly.

More Control

Digital payments give you records, visibility, and a clearer view of what is really happening in the business.

Also available as a podcast
How Cash Quietly Drains Profit from Kenyan Businesses
Cosmo Pawa · Spotify
▶ Listen on Spotify

The “free” option that is not free

A business handling KSh 100,000 a day and losing just 2% is losing KSh 2,000 every day. That is more than KSh 700,000 a year.

The real monthly cost of cash

Hidden CostMonthly Estimate
Staff shrinkage and theftKSh 24,000 to 60,000
Counting and reconciliation errorsKSh 10,000 to 20,000
Banking time and transportKSh 9,000 to 15,000
Lost sales from no-change momentsKSh 15,000 to 40,000
Security risk exposureKSh 5,000 to 20,000

Estimated total: KSh 66,000 to 163,000 per month.

That money usually does not appear as a clear “cash expense” in your books. It simply shows up as lower margins, slower growth, and profits that never feel as strong as they should.

Why most business owners miss it

Cash losses are quiet

They rarely arrive as one dramatic event. They come through under-counting, small mistakes, missing change, under-reporting, and moments no one tracks properly.

Digital fees are visible

Because the charge is easy to see, it feels more painful. But visible cost is not always the bigger cost. In many cases, cash is far more expensive.

Reality check: A 0.5% fee on KSh 3 million in turnover is about KSh 15,000. Cash losses on the same turnover can be several times higher.

The bigger problem: no data

Cash businesses often operate blind. You may know the total at the end of the day, but you do not have the detail needed to make sharper decisions.

  • No visibility into sales patterns
  • No clear staff performance data
  • No reliable history for planning
  • No strong records for lenders or compliance

With digital payments such as Lipa Na M-Pesa and a modern POS setup, every sale is logged automatically. That means better reconciliation, cleaner records, easier reporting, and fewer surprises at day-end.

Cash vs digital

Cash

Familiar, but costly

  • Hidden losses build up quietly
  • Manual counting takes time
  • Staff theft is hard to detect
  • Lost sales when change is unavailable
  • More physical security risk

Digital

Small fees, stronger control

  • Every transaction is recorded
  • Reconciliation becomes faster
  • Less cash on site means less risk
  • Better reporting and visibility
  • Stronger data for growth and compliance

Start simple

You do not need to change everything overnight. Start by adding digital payment options alongside cash, then move into a full system as the business gets more comfortable.

  • Add an M-Pesa till number
  • Accept QR payments
  • Track sales digitally
  • Upgrade to a modern POS when ready

Cash is not free. It is quietly expensive.

The sooner you reduce cash risk and improve visibility, the sooner you take back control of your margins.

Quarter-End Secrets Every Smart Retailer Needs Right Now

Q1 is wrapping up. For many Kenyan business owners — whether you run a minimart, a wine & spirits shop, a bar, or a general merchandise store — the end of March brings a familiar mix of relief and dread. Relief that the quarter is done. Dread because now you have to make sense of everything that happened over the past three months.

Receipts to reconcile. Stock to verify. Expenses to account for. Reports to pull together. In fact, for businesses still running on manual systems or basic spreadsheets, this process can eat up days of your time. As the Kenya Revenue Authority requires businesses to maintain accurate financial records, getting your books in order at quarter-end is not just good practice — it is a legal obligation.

However, if you have a POS system, the good news is: the work is largely already done. The data is there. The reports are waiting. Furthermore, unlike manual methods, a modern POS gives you instant access to everything you need in one place. You just need to know what to look for — and in what order. As a result, what used to take days can now take a few focused hours. According to Safaricom’s SME business resources, integrated digital tools are one of the biggest drivers of efficiency for small and medium businesses in Kenya — and your POS is exactly that.

Also available as a podcast

Quarter-End Secrets: The 8-Step POS Checklist Every Kenyan Retailer Needs

Cosmo Pawa · Listen on Spotify

Also available as a podcast
Quarter-End Secrets: The 8-Step POS Checklist Every Kenyan Retailer Needs
Cosmo Pawa · Spotify
▶ Listen on Spotify

Here is a practical, step-by-step checklist to help you close Q1 cleanly and fast, using your POS system.

Step 1: Pull Your Sales Summary Report

Start with the big picture. Run a sales report filtered by date range for January, February, and March separately then pull a combined Q1 total. This gives you your gross sales, returns and refunds, and net revenue for the quarter.

Compare it against Q4 of last year. Were you up or down? By how much? Which month performed strongest? A single quarterly sales report gives you more insight into your business health than almost anything else, and it takes less than five minutes to generate.

Step 2: Reconcile Your Payment Methods

Your POS tracks every payment type, cash, Mpesa, credit card, credit sales, and invoices. At quarter-end, reconcile each channel against its external record:

  • Cash: Compare your POS cash totals against actual cash counted and banked over the quarter.
  • Mpesa: Cross-check your POS Mpesa records against your Mpesa business statement or till number history.
  • Credit card: Match against your bank or card terminal settlement reports.
  • Credit/invoices: Flag any transactions marked as unpaid.

Any unexplained gaps between what the POS recorded and what actually came in are a red flag and they are far easier to trace now than six months down the line.

Step 3: Chase Outstanding Credit and Unpaid Invoices

Quarter-end is the best time to recover money owed to you. Pull up your customer accounts report and list everyone with an outstanding balance. Do the same for unpaid invoices. Note how long each amount has been outstanding anything beyond 30 days needs a direct follow-up.

The end of a quarter is a natural business milestone that makes it easier to have these conversations with customers. A simple message or phone call with a clear deadline goes a long way. Do not let credit balances roll quietly into Q2.

Step 4: Conduct a Stock Reconciliation

Your POS records every sale and every purchase order received. Run a stock valuation report and compare what the system says you should have on the shelf against what is actually there. A physical count of your fast-moving items is ideal at minimum, spot-check your top 20 products by sales volume.

Any significant gap between system stock and physical stock is inventory shrinkage, and it needs investigating. Common causes include employee theft, supplier short-delivery, spoilage, and data entry errors. Catching this at quarter-end — not year-end — keeps the losses manageable.

Step 5: Review Your Expenses

If you have been logging business expenses in your POS throughout the quarter rent, utilities, supplies, staff costs pull that report now. Calculate your total operating expenses against your net revenue. What does your gross margin look like for Q1?

Look specifically for expense categories that grew unexpectedly compared to Q4. A 10% increase in one line item might be insignificant. A 40% jump in another could indicate a problem worth addressing before it compounds over the rest of the year.

Step 6: Identify Your Best and Worst Performers

Run a product performance report ranked by units sold and by revenue generated. This tells you two important things:

  • Your top sellers: Make sure these are never out of stock going into Q2. If any ran low during Q1, adjust your reorder points.
  • Your slow movers: Products that barely shifted all quarter are tying up your capital and your shelf space. Decide now do you discount to clear them, return them to the supplier, or discontinue them entirely?

Quarter-end is the right moment to make these decisions. Acting on slow-moving stock in April is far better than discovering it again in June.

Step 7: Reconcile Your Supplier Accounts

Check your supplier transaction history for Q1. Are there any outstanding balances you owe? Any credits owed to you from returns or disputed deliveries? Reconciling your supplier accounts quarterly prevents disputes from piling up, keeps your credit terms in good standing, and gives you a clearer picture of your payables as you plan Q2 cash flow.

Step 8: Review User Activity and Access Logs

A well-configured POS records every action taken by every user — who processed sales, who made voids, who approved discounts, and who ran returns. At quarter-end, review these logs. Look for:

  • Unusual void or refund patterns: A high number of voids by a single user is worth investigating.
  • Unauthorised discounts: Any discounts applied outside approved levels.
  • Off-hours transactions: Sales processed at unusual times that do not match your operating hours.

This is not about distrust it is about accountability. Reviewing access logs as a quarterly habit is one of the simplest ways to deter internal theft and maintain operational integrity. For a deeper look at how POS theft happens and how to prevent it, read our guide on POS security for African retailers.

The Bigger Picture: Your POS Is More Than a Till

A lot of business owners treat their POS as a way to ring up sales and print receipts. And while it does that job perfectly, the real value sits in the reports. Every transaction your system records is a data point that when reviewed regularly tells you exactly where your business stands and where it is going.

Closing your books at quarter-end is not just an administrative task. It is how you find the leaks before they become floods. It is how you spot opportunities before your competitors do. And it is how you walk into Q2 with confidence rather than guesswork.

The businesses that grow consistently in Nairobi’s competitive retail environment are not always the ones with the biggest budgets or the best locations. They are the ones where the owner knows their numbers — and uses them.

Q1 is done. Q2 starts fresh. Make sure you go into it with clean books, clear stock, and a plan.

The Ultimate Kenya Payment Guide 2026: Cash, M-Pesa & Card

Kenya has been called the world’s most cash-light economy — yet cash still dominates 8 out of 10 daily purchases. The full picture of how Kenyan shoppers pay in 2026 is more layered, more regional, and more commercially important than any single headline suggests.

Whether you run a supermarket in Nairobi, a hardware shop in Nakuru, or a restaurant in Mombasa, the payment methods you accept directly affect how many customers you can serve, and how much revenue you leave on the table.

Here’s what the data actually shows.

The 2026 Snapshot: Three Payment Worlds, One Market

Walk into a supermarket in Westlands and someone will tap a card. Hail a boda-boda in Eldoret and you’ll almost certainly hand over notes. Order from a kiosk in Kisumu and a phone will ping. Kenya’s payment landscape isn’t a single race with one winner — it’s three parallel systems, each dominant in its own lane.

The 2024 FinAccess Household Survey and Central Bank of Kenya data give us the clearest picture yet:

  • 79.8% of daily expenses are still paid in cash
  • 13.1% of daily expenses go through mobile money — almost entirely M-Pesa
  • Card POS payments reached KES 297 billion in 2025, with 61.7 million transactions recorded

These aren’t competing forces so much as complementary layers. What has shifted dramatically over the past two years is where each layer is growing — and what that means for businesses still accepting only one method.

Cash: Still King — But Quietly Receding

Despite every mobile-money headline, cash remains Kenya’s dominant payment method by a wide margin. In open-air markets, matatus, roadside dukas, and informal service providers, cash isn’t just accepted — it’s expected.

The reason is structural. Most Kenyan retail still happens in informal settings — wayside kiosks, produce markets, jua kali workshops — where POS machines are absent and mobile money fees on micro-transactions can feel punishing on the seller’s side. A KES 50 transaction doesn’t easily absorb a transfer fee.

That said, the direction of travel is clear. Cash handled by mobile money agents — the proxy for money being “cashed out” from digital wallets — fell 5.3% in 2025 to KES 8.2 trillion, down from KES 8.7 trillion the previous year. Consumers are increasingly keeping money digital for longer before converting to cash.

Who still prefers cash? Rural consumers, informal sector workers, older demographics, and anyone transacting in low-value, high-frequency contexts: market traders, food vendors, transport workers, and household staff. It’s also the universal fallback when mobile networks go down.

For business owners: Refusing cash in Kenya in 2026 is still commercially risky, particularly outside major urban centres. The right question isn’t “should we accept cash?” — it’s “how do we reconcile cash alongside our other channels efficiently?”


M-Pesa: The Backbone of Digital Kenya

If cash is Kenya’s legacy system, M-Pesa is its operating system. Launched in 2007, Safaricom’s platform has grown into something far beyond a payment tool — it’s national infrastructure. And 2025 figures confirm its position is more entrenched than ever.

M-Pesa by the numbers (2025/2026):

MetricFigure
Monthly active users37.9 million
Mobile money market share~90%
Registered merchant tills2.4 million
Active agents319,000+
Revenue contribution to Safaricom44% of total service revenues

One figure stands out: M-Pesa now has more monthly active users (37.9 million) than the Safaricom mobile network has subscribers (37.5 million). Mobile money has officially outgrown the telco that built it.

M-Pesa generated KES 88.1 billion in just the first half of Safaricom’s FY26 — outperforming mobile data, voice calls, and SMS combined. That commercial weight explains why the platform continues to receive heavy infrastructure investment, including a new Fintech 2.0 platform capable of processing up to 8,000 transactions per second.

Looking ahead, Safaricom is rolling out NFC “Tap to Pay” capabilities via mobile phones, wallet sharing features, AI-powered fraud detection, and deeper merchant analytics. M-Pesa’s role in retail commerce is about to deepen significantly.

Who prefers M-Pesa? Almost everyone, but particularly urban and peri-urban consumers aged 18–54, SME owners, freelancers, and anyone purchasing from a business with a merchant till number. Any business without a Buy Goods or Paybill number is already turning away the majority of digitally active shoppers.

Card Payments: The Slow-Burn Contender

Cards in Kenya have never had a viral moment. No single government mandate, no behavioural shock that turned the country card-first. Instead, cards have done something more durable: grown steadily, year on year, almost without interruption.

The 2025 data from the Central Bank of Kenya tells the latest chapter:

  • Card POS value: KES 297 billion (up from KES 291.9 billion in 2024)
  • POS transaction volume: 61.7 million (up 4.1%)
  • POS terminals deployed: 54,454 (up from 48,653 at end-2024)

Cards occupy a distinct lane in Kenya, they thrive where formality meets record-keeping. Supermarkets, fuel stations, hotel counters, pharmacies, mid-tier restaurants. The invisible hand nudging this growth: merchants typically absorb the interchange fee, making the payment feel costless to the buyer at point of swipe.

Visa holds approximately 56% of card brand share in Kenya, with Mastercard at 44%. Credit card penetration remains below 7% of the population — the growth is overwhelmingly in debit cards linked to bank accounts.

Who prefers cards? Formally employed Kenyans, business professionals, tourists, diaspora returnees, and consumers making mid-to-high-value purchases at organised retail outlets. Nairobi and Mombasa account for the majority of card transaction volume.

Side-by-Side: What Each Method Does Well

💵 Cash📱 M-Pesa💳 Card
Accepted across Kenya✅ Universal✅ Near-universal⚠️ Urban/formal only
Works offline✅ Always❌ Needs network❌ Needs network
Transaction record❌ None✅ SMS confirmation✅ Full digital record
Fee-free for merchant✅ Yes⚠️ Tiered fees⚠️ Interchange rate
Theft/fraud risk❌ High (theft)⚠️ Low-moderate⚠️ Low (chip+PIN)
Works for e-commerce❌ No✅ Paybill/API✅ Online payments
Speed at point of sale⚠️ Counting time✅ Fast (till/QR)✅ Fast (tap/swipe)
Reconciliation burden❌ High (manual)⚠️ Medium✅ Low (auto)

What’s Actually Shifting in 2026

1. High-value retail is migrating to cards

Mobile money agent data from 2025 revealed a telling pattern: total cash value handled by agents fell 5.3%, yet transaction volumes rose 2.5%. Average ticket sizes are shrinking. Consumers aren’t abandoning mobile money — they’re using it more frequently for smaller purchases, while larger transactions increasingly route through bank cards. Groceries above KES 5,000. Electronics. Fuel. Travel. These are becoming card-first categories in urban centres.

2. M-Pesa’s merchant network is the largest in Kenyan financial history

With 2.4 million merchant tills and over 319,000 active agents, M-Pesa’s physical footprint is larger than all other Kenyan financial institutions combined. Not being integrated is no longer a minor gap — it’s a structural competitive disadvantage.

3. Contactless and NFC are converging the two digital channels

Safaricom’s Fintech 2.0 platform is laying the groundwork for NFC-based tap-to-pay from mobile phones. Combined with the steady growth of contactless card terminals, the distinction between mobile money and card payments is about to blur. A customer in 2027 may tap their phone for a KES 2,000 restaurant bill — and it might route through either channel depending on their wallet settings.


How PawaPOS Helps You Accept All Three

The data makes one thing clear: Kenyan shoppers don’t have a single preferred payment method. They switch based on context, habit, and what’s convenient in the moment.

PawaPOS is built around that reality. Accept M-Pesa (Lipa Na Buy Goods and Paybill), Visa and Mastercard, and cash, all from one unified system. Every transaction, regardless of method, flows into the same dashboard for real-time reconciliation.

No more separate till records for cash. No more cross-referencing M-Pesa SMS confirmations with your sales log. No lost sales because a customer’s preferred method isn’t supported.

Multi-Payment

Every way
Kenyans pay,
in one place.

Stop turning away customers because of how they want to pay. PawaPOS unifies M-Pesa, card, and cash into a single checkout — with real-time reconciliation across all methods.

Explore PawaPOS
No setup fees
Free training
Works offline
📲

M-Pesa Lipa Na

Buy Goods & Paybill — instant confirmation, zero manual reconciliation.

💳

Visa & Mastercard POS

Tap, swipe or insert — all card payments logged automatically to your dashboard.

💵

Cash with Float Tracking

Automatic float management — track every note in and out with full audit trail.

📊

Unified Sales Dashboard

All payment methods in one view — no spreadsheets, no end-of-day guesswork.

Real-Time Confirmation

Every payment confirmed instantly — no delays, no disputes, no lost receipts.

🔄

Offline & Auto-Sync

Keep selling during outages. All transactions sync automatically when you reconnect.

Accepts M-PESA VISA MASTERCARD CASH

E-TIMS 2026: What Every Kenyan Retailer Must Know

If you run a shop, supermarket, bar, or any retail business in Kenya, 2026 is not the year to look the other way on tax compliance. The Kenya Revenue Authority (KRA) has rolled out a sweeping new digital enforcement framework, and at the centre of it all is E-TIMS — the Electronic Tax Invoice Management System.

Whether you already use it or are hearing about it for the first time, this guide breaks down exactly what E-TIMS is, why it matters more than ever in 2026, and the practical steps your business needs to take to stay on the right side of KRA.

⚡ The Big Change in 2026

From January 1, 2026, KRA automatically cross-checks every tax return you file against your E-TIMS invoices. Any expense not backed by a valid E-TIMS invoice can be disallowed — meaning it becomes taxable income. This is not a future threat. It is happening now.

1. What Is E-TIMS?

E-TIMS (Electronic Tax Invoice Management System) is KRA’s digital invoicing platform that requires businesses to generate, transmit, and store all tax invoices electronically — in real time.

Think of it as a direct digital link between your business and KRA. Every time you make a sale and issue an invoice, that invoice is transmitted to KRA’s servers automatically.

A brief history of how we got here:

  1. 2005 — KRA introduced Electronic Tax Registers (ETRs) to track VAT.
  2. 2021 — TIMS launched, integrating ETR machines with iTax.
  3. 2023 — The Finance Act made E-TIMS mandatory for ALL businesses, not just VAT-registered ones.
  4. 2024 — Regulations gazetted; the KSh 5 million exemption was scrapped entirely.
  5. 2026 — Automated validation begins. Every return is now cross-checked against E-TIMS data.

2. Who Needs to Comply?

Short answer: virtually every business in Kenya. The common myths have now been busted:

Common MythThe Reality
"I'm not VAT registered, so I'm exempt"Not anymore. ALL businesses must register regardless of VAT status.
"My turnover is below KSh 5 million"The KSh 5 million exemption has been scrapped. Every business must comply.
"I'm too small for KRA to notice"KRA's automated system validates returns digitally — size does not protect you.
"I'll sort it out during filing season"Compliance starts at the point of sale. Retroactive fixes are costly and risky.

3. What Exactly Changed in January 2026?

From January 1, 2026, KRA introduced automated cross-validation of tax returns. When you file on iTax, the system checks your declared figures against three sources:

  • Your E-TIMS invoice records — all sales you issued invoices for
  • Withholding tax data — amounts deducted from or paid by you
  • Customs import records — goods brought in from abroad

Real-world example: A minimart owner buys stock worth KSh 800,000 from a supplier not on E-TIMS. When that expense is claimed, KRA flags it — no matching invoice. The expense is disallowed, and the owner pays tax as if they earned KSh 800,000 more than they did.

It’s not just your compliance that matters — it’s the compliance of every supplier you buy from.

4. What Happens If You Don't Comply?

  • Disallowed expenses: Purchases without E-TIMS invoices are rejected as deductibles — raising your taxable income automatically.
  • Return rejections: KRA can reject your return even after you’ve paid your taxes.
  • Financial penalties: The penalty is twice the tax due.
  • Tax audits: Discrepancies flag your business for closer scrutiny.
  • Loss of TCC: No Tax Compliance Certificate means no government tenders, no import clearances, difficulty renewing licences.
  • Lost customers: More buyers are demanding E-TIMS invoices. Businesses that can’t provide them are losing contracts.

5. How Do You Get Started with E-TIMS?

Step 1 — Visit the eTIMS Portal:
Go to etims.kra.go.ke and click Sign Up. You’ll need your KRA PIN and access to your iTax-registered phone number for an OTP.

Step 2 — Choose your solution:
Options include the eTIMS Client (desktop), eTIMS Web Portal, eTIMS Lite via USSD, or system-to-system integration for businesses with existing software.

Step 3 — Integrate with your POS:
Connect E-TIMS directly to your point-of-sale system so invoices are transmitted automatically at each sale — zero manual effort.

Step 4 — Capture buyer PINs:
For all B2B transactions, include the buyer’s KRA PIN on the invoice.

Step 5 — Reconcile monthly:
Don’t wait until filing season. Confirm all invoices are transmitting correctly every month.

6. How PawaPOS Makes E-TIMS Compliance Seamless

For Kenyan retailers using PawaPOS, E-TIMS compliance is built directly into the system — no separate workflow, no separate device, no separate login.

Every time a sale is processed, PawaPOS automatically generates an E-TIMS-compliant invoice and transmits it to KRA in real time:

  • No manual uploads at the end of the day
  • Every sale recorded and transmitted — even across multiple branches
  • Your PawaPOS records always match what KRA sees
  • Tax season reconciliation is already done

For supermarkets, bars & restaurants, wine & spirits shops, and general merchants — PawaPOS is designed around how Kenyan retail actually works: M-Pesa, multi-store stock, and offline invoicing included.

7. Quick Compliance Checklist

Done?Action Item
Registered on eTIMS portal with your KRA PIN
Chosen an eTIMS solution that fits your business
Integrated eTIMS with your POS or billing system
All sales invoiced and transmitted to KRA automatically
Capturing buyer KRA PINs on all B2B invoices
Verifying key suppliers are eTIMS-compliant
Running monthly reconciliations between POS and eTIMS records
Updated Tax Compliance Certificate (TCC) with KRA
Finance team aware of 2026 validation rules and implications

The Bottom Line

E-TIMS compliance in 2026 is not optional, and it’s not just a back-office task for your accountant. It starts at the point of sale — every transaction, every day. Retailers who get this right avoid penalties and gain cleaner records, smoother tax filing, and the credibility of being fully compliant.

The question is no longer whether to comply. It’s whether your current setup makes compliance happen automatically, every time.

Want to see how PawaPOS handles E-TIMS for your business?

Book a free demo today and we'll walk you through how our built-in E-TIMS integration keeps you compliant — automatically.

📞 +254 710 901 965  |  ✉ hello@cosmopawa.com  |  cosmopawa.com

Note: This article is for informational purposes only. For specific tax advice, consult a certified tax professional or visit kra.go.ke.

Smart Stocking: Your Guide to a Profitable Festive Season

The air is already buzzing with that festive energy, isn’t it? For Kenyan retailers, the Christmas season is the biggest opportunity of the year, a chance to turn a good year into a great one. We’ve seen the crazy rush for Christmas garlands and decorations start earlier every year, a clear sign that demand is soaring.

But let’s be real. While the spirit is willing, the pocket is sometimes weak. Recent reports have highlighted concerns about tight budgets and low disposable income potentially dampening the usual Christmas cheer. This means that to maximize your profits this year, you can’t just stock everything. The secret to a successful, smart Christmas lies not just in what you stock, but precisely when and how much.

This is your no-nonsense guide to stocking timing and levels, designed to help you navigate the festive rush, avoid costly stockouts, and ensure every shilling you invest turns into a healthy profit.

1. Timing is Everything: Beat the Rush

In the world of Kenyan retail, especially during the holidays, waiting for the last minute is a recipe for disaster. The festive season brings compressed delivery windows and increased supply chain challenges. If you wait, you risk delays, higher transport costs, and, worst of all, empty shelves when customers are ready to buy.

The Golden Rule: Forecast Early, Order Earlier.

You need to fine-tune your forecasting now, not on the Christmas week. Look at last year’s sales data, identify your top 10 sellers, and place your orders for these high-demand items before the rush truly begins.

Item Category When to Stock Why?
Christmas Decor (Garlands, Lights, Trees) Late October – Early November Demand starts early; these are high-margin, must-have items.
High-Demand Gifts (Electronics, Toys, Trendy Fashion) Mid-November Allows for a buffer against shipping delays and gives you a competitive edge.
Perishables/Food Items (Specialty Goods) Early December Closer to the date, ensuring freshness, but still allowing for bulk purchase discounts.

2. The Goldilocks Zone: How Much to Stock

The goal is to find the Optimal Inventory Level, that sweet spot where you have enough stock to meet demand without having so much that you’re left with piles of unsold goods in January 4. This level is determined by monitoring three key factors: lead times, safety stock, and forecasted sales.

JIT vs. JIC: A Hybrid Approach

You’ve probably heard of Just-in-Time (JIT) and Just-in-Case (JIC) inventory.

  • Just-in-Time (JIT): Reduces excess supply and keeps your cash flow lean. Great for slower-moving, high-cost items.
  • Just-in-Case (JIC): Maintains a larger inventory to avoid stockouts, especially when supply chains are unpredictable (which they are during the holidays!).

For the Kenyan Christmas rush, we recommend a Hybrid Approach:

1.JIC for Must-Haves: Use JIC for your top-selling, high-demand, and locally-sourced items (like those popular garlands or essential food items). A small investment in safety stock here is worth the peace of mind and guaranteed sales.

2.JIT for High-Cost, Slow-Turn Items: Use JIT for expensive, niche, or non-essential items. Order smaller quantities and be ready to re-order quickly if demand surprises you.

The Profitability Check: Stock Turn

How do you know if your stocking levels are working? You check your Stock Turn 5.

Stock Turn is a key performance indicator (KPI) that measures how many times your average inventory is sold and replaced over a period. A high stock turn means your inventory is moving fast, which is great for cash flow and profitability.

To maximize profits, you need to focus on items with a high stock turn. If an item is sitting on your shelf for too long, it’s eating into your profits. Proper retail allocation helps you meet customer demand and maximize profitability by reducing excess inventory 6.

3. Ksh-Smart Strategies for the Kenyan Market

Given the tight budgets facing many consumers, your strategy must be sensitive to price.

Stock a Range of Price Points

Don’t just stock the premium items. Ensure you have a good mix of affordable gifts and essentials. A customer who can’t afford the Ksh 5,000 gift might happily buy the Ksh 500 stocking filler. This ensures you capture sales across all consumer segments.

Use FIFO to Protect Your Investment

The First In, First Out (FIFO) approach is crucial for managing your stock and cash flow 7.

  • FIFO Principle: The oldest inventory items (those bought first) are sold first.
  • Why it matters: For trendy Christmas items, this prevents you from being stuck with last season’s stock in the new year. For food items, it prevents spoilage. By moving older stock first, you keep your inventory fresh and your cash flow healthy.

Final Call to Action: Audit Your Stock Now

Don’t wait for the last minute. Audit your stock today. Identify your low-turn stock and consider running a pre-Christmas sale to clear it out. Use the cash generated to invest in the high-demand items that will make your Christmas season a success.

POS Security for African Retailers: How to Prevent Theft and Protect Profits

For the vibrant and rapidly evolving retail sector across Africa, the Point-of-Sale (POS) system is more than just a cash register, it is the central nervous system of the business. From bustling dukas in Nairobi to modern supermarkets, the POS is where commerce happens. However, this critical financial hub is also a prime target for theft and fraud, a silent threat that can erode profits and threaten the sustainability of small and medium enterprises (SMEs).

The challenge is particularly acute in markets like Kenya, where the retail sector leads in suspected digital fraud attempts. Understanding the unique forms of POS theft prevalent in the African context, which often blend traditional cash-based risks with modern digital vulnerabilities, in addition to tracking and monitoring inventory movement is the first step toward building a robust defense.

The Dual Threat: External Fraud and Internal Betrayal

POS theft can be broadly categorized into two main areas: External Fraud (perpetrated by customers or external criminals) and Internal Theft (perpetrated by employees).

1. External Fraud: Targeting the Digital and Mobile Frontier

In a market dominated by mobile money and digital payments, external fraud often targets these new frontiers.

Type of FraudAfrican/Kenyan ContextPrevention Strategy
Digital FraudHigh rates of digital fraud attempts, with the retail sector being a primary target. This includes phishing, identity theft, and malware targeting POS systems.Tighten POS security systems, train cyber security personnel, and ensure all software is regularly updated and patched.
Mobile Money Fraud (e.g., M-Pesa)Fraudulent purchases directed to personal Till Numbers, or price manipulation during mobile money transactions.Implement POS systems that integrate securely with mobile money platforms. Use fraud detection models to flag suspicious transactions.
Card Testing FraudCriminals make numerous small online payments to verify stolen card numbers before larger fraudulent purchases.Implement fraud detection systems that flag multiple small, rapid transactions from the same source.

2. Internal Theft: The Insider Threat to Cash and Inventory

Internal theft, or employee theft, is particularly damaging as it exploits trust and system access. This is a significant concern, especially where cash transactions are still prevalent, leading to a higher risk of theft by both external criminals and internal employees, unless you understand how to spot such loopholes.

  • Fraudulent Voids and Returns: An employee voids a cash transaction after the customer has paid, then pockets the cash. For example, voiding a KES 5,000 sale and stealing the money. They may also process a fake return for an item never purchased and take the cash refund.
  • “Sweethearting” and Discount Abuse: An employee intentionally fails to scan merchandise or applies unauthorized discounts for friends or family, effectively giving away goods.
  • Cash Skimming: Taking small amounts of cash from the register throughout the day, often by manipulating the price of an item or simply pocketing a portion of the cash payment.
  • Till Number Manipulation: An employee directs a customer to pay via a personal mobile money till number instead of the business’s official till, leading to direct cash loss.

Building a Fortress: Prevention Strategies for African Retailers

Protecting your business requires a multi-layered approach that combines technology, policy, and vigilance, tailored to the local environment.

Area of FocusKey Prevention Measures
Technology & SecuritySecure Mobile Money Integration: Ensure your POS system securely logs all mobile money transactions, linking them directly to the sale. Inventory Management: Use real-time inventory tracking to quickly identify shrinkage (losses due to theft, spoilage, or error). Data Encryption: Encrypt all payment data to protect customer information and reduce liability.
Operational PolicyStrict Permissions: Set up individual employee accounts with limited permissions. Require manager approval for high-risk actions like voids, no-receipt returns, or large discounts. Regular Audits: Conduct frequent, unannounced audits of cash drawers, inventory, and transaction logs to spot discrepancies.
Employee ManagementCommunicate Policies: Clearly outline policies on cash handling, mobile money transactions, and returns during training. Emphasize that all POS activity is monitored. Background Checks: Conduct thorough background checks on all new hires, especially those handling cash and sensitive data.

The growth of the African retail sector is a story of innovation and resilience. However, this growth must be protected from the persistent threat of POS theft. By acknowledging the unique risks, from digital fraud attempts to the manipulation of mobile money systems, and implementing robust, locally-aware security measures, such the ones available in stable POS solutions such as PawaPos and Nexx Retail, African retailers can safeguard their hard-earned profits. Securing your POS system is not just a technical task; it is a fundamental investment in the financial health and long-term success of your business.

The One Secret Weapon for Retail Business Success!

Do you ever wish you could be in two places at once? Imagine running your bustling Small retail business, serving your amazing customers, and then, at the end of the day, getting a crystal-clear picture of everything that happened, even if you weren’t physically there. Sounds like a dream, right? Well, it’s not! It’s the power of daily operational snapshots, and it’s about to become your new best friend

What Exactly Are Daily Operational Snapshots?

Think of a daily operational snapshot as a comprehensive, bite-sized report that summarizes your business’s performance over the past 24 hours. It’s not just about sales figures; it’s a holistic view that can include everything from inventory levels and customer transactions to employee performance and even marketing campaign effectiveness. Essentially, it’s a data-driven story of your day, told through key metrics and insights

For a POS (Point of Sale) business, this means gaining a clear understanding of various aspects, including sales performance—what sold, how much, and when, along with identifying the star products of the day. It also encompasses transaction details such as the total number of transactions, the average transaction value, and the payment methods utilized. Furthermore, it provides insights into inventory movement, tracking what stock arrived, what was sold, and what remains on the shelves. Crucially, these snapshots offer valuable customer insights, highlighting peak hours, popular items, and even feedback captured directly through your POS system such as PawaPos. Finally, they shed light on employee activity, detailing who was on shift, their individual sales performance, and any relevant operational notes.

These snapshots are often generated automatically by modern POS systems, making it incredibly easy to access crucial information without sifting through mountains of raw data. They transform complex daily activities into actionable intelligence.

Why Daily Snapshots Are Your Business Superpower

In any business setup, where competition is fierce and customer expectations are high, having a finger on the pulse of your business daily isn’t just an advantage, it’s a necessity. Here’s why daily operational snapshots are a superpower for POS businesses:

1. Make Informed Decisions, Fast!

Imagine this: it’s Monday morning, and you’re reviewing your Sunday snapshot. You notice a sudden spike in sales for a particular product, or perhaps a dip in overall transactions during certain hours. With this immediate insight, you can quickly adjust your inventory, tweak your staffing schedule, or launch a flash promotion to capitalize on trends or mitigate issues. No more waiting until the end of the month to discover what happened; you know now. This agility is crucial in fast-paced market.

2. Spot Trends and Opportunities

Daily snapshots help you identify patterns that might otherwise go unnoticed. Is there a specific day of the week when a certain item always sells out? Are your customers preferring mobile payments over cash more frequently? Recognizing these trends allows you to optimize your stock, tailor your marketing efforts, and even introduce new services that align with customer behavior. For instance, if you notice a consistent demand for a particular fresh produce item at your Nairobi greengrocer, you can ensure you’re always well-stocked.

3. Boost Accountability and Performance

When your team knows that their daily performance is being tracked and reviewed, it naturally fosters a greater sense of accountability. Daily reports can highlight individual sales achievements, identify areas where training might be needed, and celebrate successes. This transparency can motivate your staff to perform better, leading to improved customer service and increased sales. In Nairobi’s competitive retail environment, a motivated team is a winning team.

4. Prevent Losses and Detect Anomalies

Daily operational snapshots act as an early warning system. Irregularities in sales, unexpected inventory discrepancies, or unusual transaction patterns can be flagged immediately. This allows you to investigate and address potential issues like theft, errors, or fraud before they escalate into significant losses. Protecting your hard-earned profits is paramount for any business, especially in a market where margins can be tight.

5. Work Smarter, Not Harder (Even When You’re Away!)

One of the biggest advantages for business owners is the peace of mind that comes with remote oversight. Whether you’re managing multiple locations, taking a much-needed break, or attending to other commitments, daily snapshots ensure you’re always connected to your business’s pulse. You can review performance from anywhere, make strategic decisions, and communicate with your team effectively, all without being physically present. This is invaluable for Nairobi entrepreneurs who are often juggling multiple responsibilities.

6. Better Inventory Management

For POS businesses, inventory is often the largest asset. Daily snapshots provide real-time data on what’s selling and what’s not, helping you make informed decisions about purchasing and stock levels. This prevents overstocking (tying up capital) and understocking (missing out on sales), leading to optimized cash flow and reduced waste. Effective inventory management is a cornerstone of profitability for Nairobi retailers.


How to Implement Daily Operational Snapshots in Your Nairobi POS Business

Implementing daily operational snapshots might sound complex, but with the right tools and approach, it’s surprisingly straightforward. Here’s how you can get started:

1. Invest in a Modern POS System

The foundation of effective daily snapshots is a robust and modern Point of Sale (POS) system. Many contemporary POS solutions, especially those designed for small to medium-sized businesses, come equipped with powerful reporting features. Look for systems that offer customizable daily reports, real-time data synchronization, and cloud-based access so you can monitor your business from anywhere. In Nairobi, there are several providers offering tailored POS solutions that understand the local market dynamics.

2. Define Your Key Performance Indicators (KPIs)

What metrics matter most to your business? While sales are always important, consider other KPIs like average transaction value, popular product categories, inventory turnover rate, customer footfall (if tracked), and even employee sales per hour. Defining these upfront will help you customize your daily reports to focus on what truly drives your business success.

3. Train Your Team

Your POS system is only as good as the people using it. Ensure your staff is thoroughly trained on how to accurately process sales, manage inventory, and utilize any customer data features. Consistent and accurate data entry is crucial for generating reliable daily snapshots. Regular training refreshers can also help keep everyone up-to-date with best practices.

4. Automate Reporting

Leverage your POS system’s capabilities to automate the generation and delivery of daily reports. Many systems can be configured to email you a summary report at the end of each business day or first thing in the morning. This automation saves time and ensures you consistently receive the information you need without manual effort.

5. Regularly Review and Act on Insights

Receiving daily reports is just the first step; the real value comes from reviewing them and taking action. Set aside a dedicated time each day (perhaps over your morning coffee!) to go through your snapshot. Look for anomalies, celebrate successes, identify areas for improvement, and make informed decisions based on the data. This consistent review cycle will transform your business operations.

In the competitive business landscape, staying ahead means being informed and agile. Daily operational snapshots provide you with the clarity and control you need to navigate challenges, seize opportunities, and ultimately, grow your POS business. They empower you to make data-driven decisions, optimize your operations, and gain peace of mind, knowing exactly where your business stands, every single day.

Don’t let your business run on guesswork. Embrace the power of daily operational snapshots and unlock your full potential. Your future self (and your bottom line!) will thank you.