Infographic about understanding production costs in a Kenyan food factory, showing workers, packaging, and cost charts.

7 Proven Ways Kenyan Producers Slash Their Production Costs

If you manufacture or process goods, whether you run a bakery in Westlands, a juice factory along Thika Road, or a packaging business in Mombasa, your ability to price correctly and stay profitable starts with one thing: understanding your true production costs. Yet for most Kenyan SME manufacturers, production costing is either done on gut feel, a rough spreadsheet, or not at all. That gap between what things feel like they cost and what they actually cost is where margins disappear.

Kenya’s manufacturing sector is growing contributing 7.8% to GDP and generating over 352,000 direct jobs and SMEs are the engine powering that growth. But SMEs make up 98% of all businesses in Kenya while contributing only a fraction of total manufacturing output. One reason for that gap is operational businesses that can’t accurately cost their products can’t scale them. This guide breaks down production costing in plain language, with practical examples grounded in the Kenyan business context.

What Are Production Costs, and Why Do They Matter?

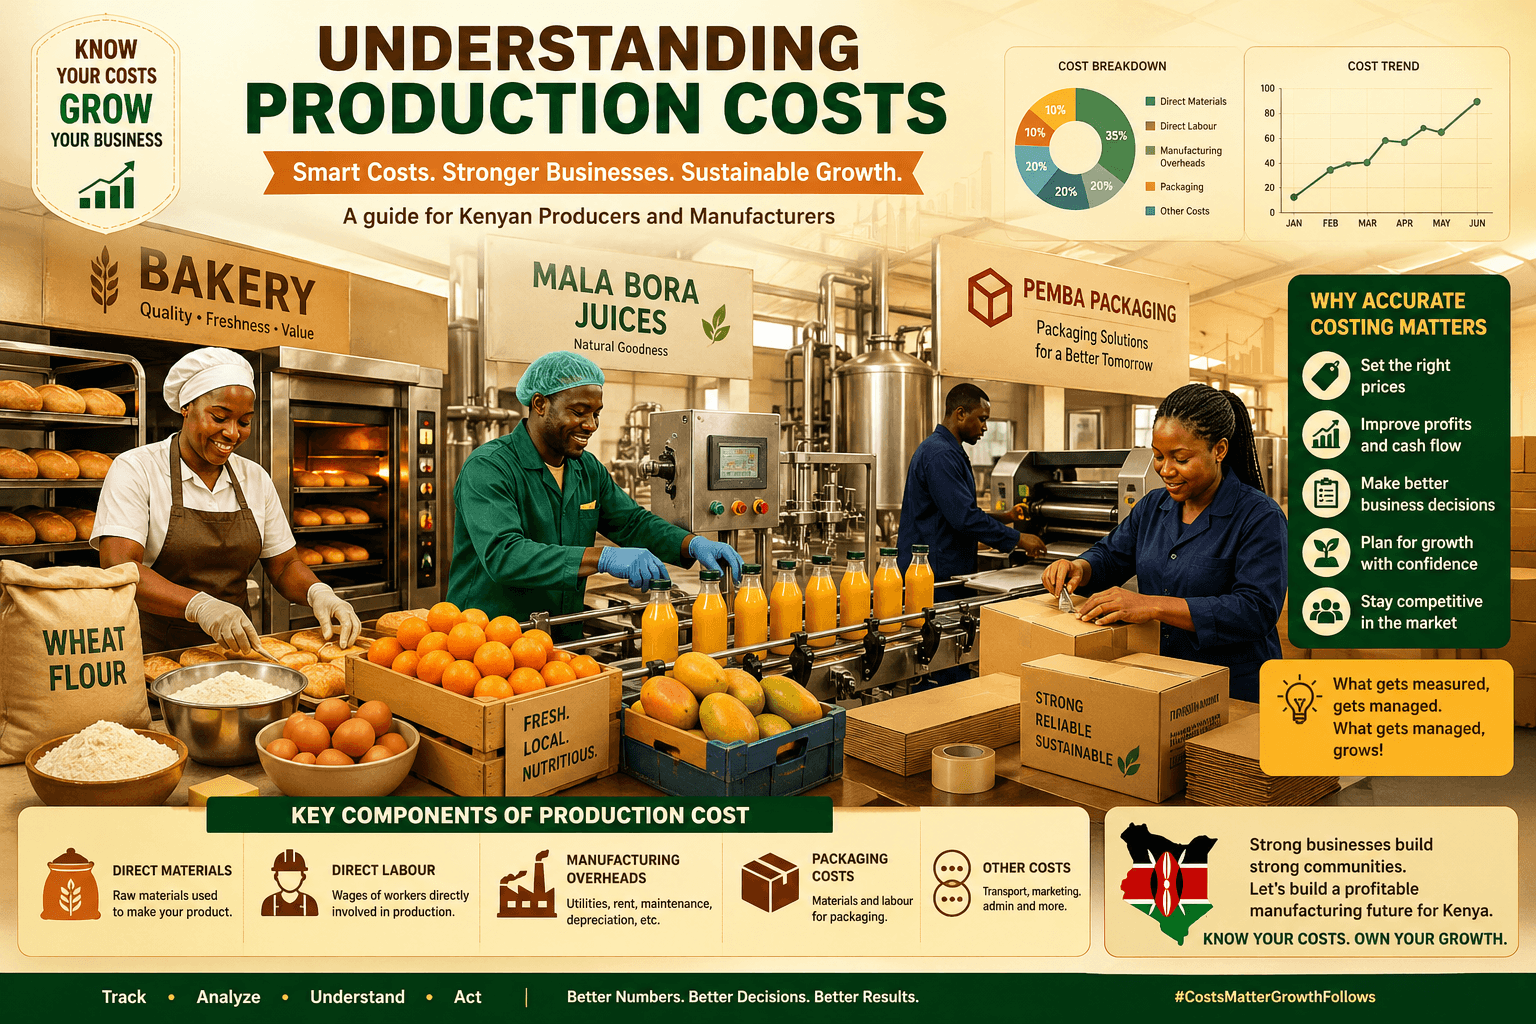
Production costs are every expense that goes into making a finished product from the raw ingredients you buy, to the electricity powering your machines, to the wages of the people on your production floor. Product costs are grouped into three core categories: direct materials, direct labour, and manufacturing overhead. Together, these three elements make up your total cost per unit the number that determines whether you’re pricing to profit or pricing to loss.

Here’s why this matters in the Kenyan context: rising input costs fuel, packaging, flour, cooking gas are squeezing margins across the food production and FMCG sectors. If you don’t know your exact production cost, you cannot respond to input price changes intelligently. You either absorb the loss silently or reprice blindly and risk losing customers.

The Three Pillars of Production Costing

1. Direct Materials — Your Bill of Materials (BOM)

Direct materials are the raw inputs that physically become part of your finished product. For a mandazi bakery, it’s flour, sugar, oil, and eggs. For a juice manufacturer, it’s fruit, water, preservatives, and bottles. A Bill of Materials (BOM) is essentially the recipe, a comprehensive list of all materials, quantities, and their associated costs required to produce one unit of your product.

Getting your BOM right is the foundation of everything else. Each ingredient needs to be recorded at the correct unit of measure (grams, litres, kilograms) and at the actual purchase cost, not an estimate. The quantity formula is straightforward:

Total Ingredient Qty = (Units per pack × Number of packs) + Loose/fractional quantity

For example: a recipe needs 500 g of wheat flour, but you buy flour in 50 kg bags. Your BOM records 500 g against the cost-per-gram derived from the 50 kg bag price. Consistency in unit conversions prevents the most common costing errors and in a production environment, small per-unit errors multiply fast across hundreds or thousands of units.

The total direct material cost is calculated as:

Direct Materials Cost = Beginning Raw Materials Inventory + Purchases − Ending Raw Materials Inventory

2. Direct Labour — The Human Cost of Production

Direct labour is the cost of staff who are physically involved in making the product the person mixing dough, operating the filling machine, or assembling goods on the line. Direct labour includes wages, benefits, and any payroll taxes directly attributable to production staff.

In a Kenyan SME setting, many production staff are casual workers paid on a daily or piece-rate basis — which can make labour costs variable and easy to overlook in costing models. The key is to calculate labour cost per production batch: how many labour-hours does one batch take, and what is the total wage cost for that time? That per-batch labour cost then divides across all units produced in the batch to give you a per-unit labour contribution.

3. Manufacturing Overheads — The Costs That Hide in Plain Sight

Overheads are where most Kenyan manufacturers get stuck. They’re real costs — but they don’t sit on a single product the way flour does. Manufacturing overhead includes all indirect production expenses not explicitly tied to specific products — equipment depreciation, rent, insurance, and utilities.

Overheads typically fall into three types:

  • Fixed overheads — costs that stay constant regardless of how much you produce. Kitchen rent, equipment lease payments, a permanent factory security guard. Whether you produce 100 units or 1,000, the rent is the same.
  • Variable overheads — costs that rise and fall with production volume. Electricity consumption for machinery, cooking gas, packaging materials. Variable overheads change with shifts in production volume — the more you produce, the higher these costs go.
  • Percentage-based overheads — overheads calculated as a percentage of total raw material cost. For example, a logistics allowance set at 3% of ingredient cost, or a wastage buffer of 2%.

Common overhead items for a Kenyan food producer or manufacturer include:

  • Electricity (KPLC bills — a significant and often unpredictable overhead)
  • Cooking gas or LPG
  • Water
  • Kitchen or factory rent
  • Equipment maintenance and repairs
  • Cleaning and sanitation supplies
  • Packaging materials not captured in the BOM
  • Kitchen staff wages for non-production roles (supervisors, cleaning crew)
  • Administrative costs allocated to the production centre

Overhead costs should be allocated based on the percentage of production time or space used for each product — so if you produce two product lines sharing one kitchen, you split overhead proportionally between them.

PawaPOS
Integrate. Automate. Optimize.
Take full control of your retail business today

From stock management to M-Pesa payments and real-time reports — PawaPOS is built for Kenyan businesses like yours.

The Full Production Cost Formula

Once you have all three components, the formula is straightforward:

Total Unit Cost = Direct Materials Cost + Direct Labour Cost + Manufacturing Overhead Cost

Let’s make this real. Say you run a small nut butter production line in Nairobi:

Cost ComponentDetailAmount (KES)
Direct materialsMacadamia nuts, oil, salt, jars, labels8,400
Direct labour2 workers × 4 hrs × KES 200/hr1,600
OverheadsElectricity, gas, cleaning, rent allocation1,200
Total batch cost80 jars produced11,200
Unit production costKES 11,200 ÷ 80 jarsKES 140 / jar

With KES 140 as your floor cost, you can confidently set a retail price that covers cost, allows for distribution margin, and leaves you with profit. Without this calculation, many business owners price at KES 150 “because it feels right” — not knowing whether they’re making KES 10 margin or running a KES 5 loss after overheads.

From Recipe to Stock: The Production Lifecycle in a Managed System

In an informal or spreadsheet-based operation, costing calculations are done once — at setup — and then drift out of date as input prices change. A proper production management system ties costing to live inventory data through a structured lifecycle:

  • Recipe / BOM Configuration — each finished good is configured with its ingredient list and overhead assignments. The system computes unit cost automatically: unit cost = sum of ingredient costs + sum of overhead costs.
  • Materials Requisition (MRQ) — before a production run, a materials requisition is raised. The system explodes the recipe and calculates exactly how much of each raw material is needed for the planned production quantity.
  • Approval — the requisition is reviewed and approved by an authorised person before raw materials are released — creating a control checkpoint that prevents unauthorised production.
  • Raw Material Issuance — approved materials are issued out of inventory to the production centre, reducing stock balances in real time.
  • Finished Goods Receipt — completed goods are received back into inventory, valued at the pre-computed unit cost (ingredients + overheads). The batch is closed.

This lifecycle closes the loop between production activity and inventory accuracy — so your stock reports reflect what’s actually in your warehouse, and your cost of goods sold is correctly computed rather than estimated.

Why Most Kenyan SME Producers Undercount Their Costs

There are predictable patterns in how production costs get undercounted. Recognising them is the first step to fixing them:

  • Overheads are not assigned to products. Electricity, gas, and rent are paid as business expenses but never allocated to individual products. The cost is real — it’s just invisible in the product price.
  • Ingredient quantities are approximated. When a recipe says “a handful of salt” or “about 2 kg of flour,” costing accuracy is gone. Precise grams and litres matter.
  • Wastage and yield loss is ignored. Raw material yields are rarely 100%. Peeling, trimming, evaporation, and spoilage reduce the amount of usable input. A 1 kg orange yields roughly 400–500 ml of juice — the cost of the wasted 50–60% of the fruit must still be costed into that juice.
  • Labour is treated as a fixed business cost, not a per-product cost. Staff wages are paid whether production runs or not — but they should still be allocated to what was produced during paid production hours.
  • Input prices are not updated after supplier price changes. Costing models built six months ago with old commodity prices are actively misleading.

Research on Kenyan manufacturing SMEs shows a positive correlation between adopting structured operational technology and improved production efficiency and competitiveness — confirming that the gap between informal and formalised production management is a performance gap, not just an administrative one.

Fixed vs. Variable Overheads: Why the Distinction Matters for Pricing

Understanding whether an overhead is fixed or variable changes how you use it in pricing decisions. Manufacturing overhead must be divided up and allocated to each unit produced — but the method of allocation differs by cost type.

Fixed overheads get cheaper per unit as you produce more. If your monthly kitchen rent is KES 30,000 and you produce 1,000 units, rent contributes KES 30 per unit. If you scale to 3,000 units, it drops to KES 10 per unit. This is why volume matters so much to production profitability — fixed costs spread over more units dramatically improves your margin per unit.

Variable overheads stay roughly constant per unit regardless of scale. Electricity per unit doesn’t drop just because you’re producing more — you’re still consuming proportionally the same power per unit of output.

This distinction matters for pricing decisions: if a customer wants a bulk order at a lower price, you can offer a discount on the fixed overhead portion — not on the variable materials and direct labour portion, which are irreducible.

How PawaPOS Handles Production Costing End-to-End

PawaPOS includes a built-in production management module designed for exactly the kind of businesses described in this article — Kenyan producers in food processing, beverages, packaging, and light manufacturing who need structured costing without the complexity of enterprise manufacturing software.

Here’s how the module works in practice:

  • Overhead Master — you define overhead types (Utilities, Labour, Packaging) and individual overhead items with their cost type: fixed amount, variable per-unit rate, or percentage of raw material cost. Pre-configured overhead templates include Electricity, Water, Gas, Kitchen Staff Wages, Kitchen Rent, Equipment Maintenance, Cleaning Supplies, and Packaging Materials.
  • Stock Catalog with Bill of Materials — each finished product is configured with a full ingredient list. Each ingredient line captures the raw material, quantity in the correct unit of measure, packing conversion ratios, and unit cost. The system computes line costs (excl. VAT and incl. VAT) automatically.
  • Computed Unit Cost — unit cost is automatically calculated as the sum of all ingredient costs plus all overhead costs. This becomes the valuation rate when finished goods are received back into inventory — ensuring your stock is always valued at true production cost.
  • Materials Requisition with Recipe Explosion — when you initiate a production run, PawaPOS explodes the recipe automatically across the planned quantity and generates a materials requisition with exact raw material requirements.
  • Approval Controls — production batches require approval before materials can be released, giving management a control checkpoint over production activity.
  • Raw Material Issuance & Finished Goods Receipt — raw materials are issued from stock (reducing inventory) and finished goods are received into stock (increasing inventory at computed unit cost) — keeping inventory balances accurate throughout the production cycle.

The result: your stock reports, cost of goods sold, and profitability figures all reflect actual production reality — not estimates. You can answer the question “what does it cost me to make this?” with a number, not a guess. Learn more on the CosmoPawa website or read our related guide on managing inventory shrinkage in Kenyan retail businesses.

Free consultation

Ready to see PawaPOS in action?

Chat with our team on WhatsApp — we’ll walk you through a live demo at your convenience.

Chat With Us on WhatsApp

Typically replies within minutes

Final Thoughts

Production costing is not an accounting exercise — it’s a survival skill for any Kenyan manufacturer. Knowing your true unit cost gives you the confidence to price correctly, negotiate with distributors, respond to input cost increases, and make volume decisions intelligently. Kenya’s manufacturing growth ambitions depend on SMEs becoming more operationally sophisticated — and costing discipline is where that sophistication begins.

Whether you’re running a single production line or managing multiple production centres across branches, the principle is the same: every cost that goes into making your product must be tracked, assigned, and computed — not guessed. The businesses that know their numbers are the ones that survive input price shocks, scale profitably, and build brands that last. Chat with us on WhatsApp at +254 710 901 965 to see how PawaPOS can bring this structure to your production operation.

How to Stop Losing Money at Checkout: The Hidden Costs Kenyan Retailers Miss

Every retailer knows the frustration: customers walk in, fill their baskets, then abandon their purchases at the checkout line. It’s a silent profit killer happening in retail stores across Kenya, costing businesses thousands of shillings daily, and most don’t even realize it’s happening.

Martha Mbugua, a retail operations leader, put it perfectly: “A customer can forgive an out-of-stock item. They rarely forgive a long checkout queue.” Yet many retailers still treat their checkout as an afterthought, focusing on merchandising while losing customers at the final, most crucial step.

The checkout isn’t just where transactions happen, it’s where customers decide if they’ll return. And right now, outdated systems are bleeding your profits in ways you might not see on your daily reports.

The Real Cost of Slow Checkouts

Picture this: It’s Saturday afternoon at your store. Five customers are waiting in line, each holding items worth KES 2,500. Your cashier is manually entering prices, the customer disputes an amount, the till drawer jams, and an M-Pesa payment needs manual confirmation.

By the time you look up, two customers have left, taking KES 5,000 in lost sales with them. And they probably won’t be back.

Fast checkout isn’t a luxury, it’s a competitive advantage. When your competitors can process a transaction in 30 seconds while yours takes 3 minutes, you’re not just losing sales. You’re losing customers to businesses that respect their time.

Modern POS systems like PawaPos eliminate these bottlenecks through:

  • Lightning-fast barcode scanning – No more manual price entry
  • Instant M-Pesa verification – Payments confirmed in seconds, not minutes
  • Multi-payment options – Cash, card, M-Pesa, all in one smooth flow
  • Automatic calculations – Zero pricing disputes or manual errors

The math is simple: If you process just 10 extra transactions per day because checkout is faster, at an average basket of KES 1,500, that’s KES 15,000 daily, KES 450,000 per month in recovered sales.

The Silent Thief: Retail Shrinkage

Here’s what keeps retail owners up at night: You’re making sales, inventory is moving, but your profits don’t match the math. The culprit? Retail shrinkage—and manual systems make it almost impossible to detect.

Shrinkage comes in three forms:

1. Customer Theft

Without proper tracking, shoplifters walk out with merchandise that never appears on your loss reports. You only notice when stock counts don’t match sales—often weeks or months later.

2. Employee Fraud

Manual tills create opportunity. A cashier undercharges a friend, pockets the difference, or voids legitimate transactions. With no digital trail, these losses are nearly invisible until they’ve cost you thousands.

3. Administrative Errors

Wrong prices entered, incorrect quantities recorded, missing receipts—small mistakes that add up to significant losses over time.

The Kenya reality: Studies show retail shrinkage typically costs businesses 1-3% of total sales. For a store doing KES 2 million monthly, that’s up to KES 60,000 disappearing every month.

Modern POS systems stop shrinkage by creating complete accountability:

  • Every item scanned – No manual price entry means no “friendly discounts”
  • Digital transaction trail – Every sale, void, and refund is timestamped and tracked
  • Real-time inventory sync – Stock levels update instantly, making discrepancies obvious
  • User-level permissions – Track exactly who processed which transactions
  • Automatic reconciliation – Cash drawer amounts match sales reports to the shilling

The impact? Retailers using modern POS systems typically reduce shrinkage by 40-60%, recovering tens of thousands in monthly losses.

The M-Pesa Verification Gap

If you’re still relying on customer SMS screenshots for M-Pesa payments, you’re leaving money on the table, and exposing yourself to fraud.

Here’s what’s happening in Kenyan retail right now:

The Old Way (Still Used by Many):

  1. Customer claims they’ve sent M-Pesa
  2. They show you an SMS screenshot
  3. You trust it and release the goods
  4. Later, you realize the payment never arrived

The Modern Way with PawaPos:

  1. Customer selects M-Pesa payment
  2. System sends STK push to customer’s phone
  3. Payment is verified in real-time through API
  4. Transaction only completes when payment is confirmed
  5. Instant receipt generated

No screenshots. No trust issues. No fraud. Just verified, instant payments.

What Checkout Excellence Actually Looks Like

“Efficient checkouts come from discipline, not urgency:
• Planning staffing around traffic patterns, not schedules
• Opening tills before queues form
• Clear front-end ownership during peak hours
• Leaders actively managing flow in real time”

— Martha Mbugua, Retail Operations Leader

She’s absolutely right—but here’s what she didn’t mention: Great operations need great technology.

This is where PawaPos gives Kenyan retailers the edge:

Sub-3-Second Transactions

From scan to receipt, the entire process is lightning-fast. No lag, no waiting, no frustrated customers.

📊

Real-Time Peak Hour Detection

The system shows you live traffic patterns, helping you decide when to open additional tills—before the queue forms.

💪

Offline-First Architecture

Kenya’s internet isn’t always reliable. PawaPos keeps working even when connectivity drops, syncing automatically when it’s restored.

📱

Mobile POS Option

During peak times, turn any Android device into an additional checkout point. Process sales from anywhere in your store.

The Real-World Impact: A Nairobi Case Study

Before PawaPos:

  • Average checkout time: 4.5 minutes
  • Shrinkage: KES 40,000/month
  • M-Pesa fraud: 2-3 incidents/month
  • Abandoned baskets: 15-20%
  • Monthly revenue: KES 2.2 million

After PawaPos:

  • Average checkout time: 45 seconds ✅
  • Shrinkage: KES 14,000/month ✅
  • M-Pesa fraud: Zero ✅
  • Abandoned baskets: Less than 5% ✅
  • Monthly revenue: KES 2.8 million ✅

27% revenue increase!

Stop the Bleeding: Take Action Today

The question isn’t whether you can afford a modern POS system—it’s whether you can afford to keep losing money without one.

Ready to stop losing money at checkout?


📧 Email: info@cosmopawa.com

🏢 Visit Us:
Cosmo House, Mawe Mbili Road
(off Kangundo Road), Nairobi

Business Hours:
Monday – Friday: 8:00 AM – 6:00 PM
Saturday: 9:00 AM – 2:00 PM EAT


PawaPos is proudly Kenyan, built specifically for East African retailers. We understand your challenges because we work with businesses just like yours every day, from small shops to supermarket chains across Nairobi, Mombasa, Kisumu, and beyond.

Proudly Local. Powerfully Retail.

5 Essential Business Numbers Your Kenyan Shop Needs Now

Not knowing your business numbers is the number one silent killer of Kenyan SMEs. You can run a busy shop on Thika Road, a packed bar in Westlands, or a restaurant with tables booked every Friday night — and still be losing money every single month. These five metrics are what separate businesses that thrive from businesses that are always scrambling to make payroll.

Q2 is here. April has started. And if you’re like most SME owners in Kenya, the last three months were spent doing exactly one thing: keeping the business alive. Serving customers, restocking shelves, chasing suppliers, managing staff, handling M-Pesa reconciliations at 10 PM. Busy, busy, busy.

But here’s the uncomfortable truth: being busy is not the same as being profitable.

Why Kenyan SMEs Struggle With Financial Visibility

According to the Kenya National Bureau of Statistics (KNBS), SMEs contribute approximately 33.8% of Kenya’s GDP and account for roughly 80% of total employment. Yet a significant number of those businesses close within their first few years — not because of competition, not because of the economy, but because the owner didn’t know their numbers until it was too late.

Financial visibility isn’t a luxury reserved for big corporates with finance departments. It’s the basic operational intelligence every wafanyabiashara needs — whether you’re running one outlet in Gikomba or three branches across Nairobi. And the good news: you only need to track five numbers to get started.

80% of SME employment in Kenya depends on businesses that often have no reliable system for tracking their own financial performance.

Kenya National Bureau of Statistics (KNBS)

The 5 Business Numbers You Must Know — Starting This Quarter

① Daily Sales Average (DSA)

This is the simplest number on this list — and the one most owners get wrong because they rely entirely on gut feel. Your Daily Sales Average (DSA) tells you exactly how much revenue your business generates on a typical day, removing the noise of a good Saturday or a slow Monday after a public holiday.

DSA = Total Monthly Revenue ÷ Number of Trading Days

Why does this matter in Q2? Because it gives you a concrete baseline to measure against. If your DSA drops two weeks in a row, something has changed — a competitor opened nearby, a key staff member isn’t performing, or a supplier issue is affecting your stock availability. Without the number, you won’t see it coming.

💡 PawaPOS tip: Your PawaPOS dashboard displays your daily sales trend automatically — including a comparison against the previous period. No spreadsheets, no manual calculations. You see the number the moment you open the app.

② Cost of Goods Sold (COGS)

Revenue is vanity. Profit is sanity. And you cannot calculate profit without knowing your Cost of Goods Sold. COGS tells you exactly how much it costs to produce or stock the products you sold in a given period.

COGS = Opening Stock + Purchases − Closing Stock

For a Nairobi bar or restaurant, this includes raw ingredients, beverages, and any consumables that go directly into what you serve. For a retail shop, it’s your purchase price for every item sold. If your COGS is creeping up and your revenue is flat, your margins are quietly being squeezed — and most owners don’t catch this until the damage is done.

💡 PawaPOS tip: PawaPOS tracks every sale and purchase in real time, so your COGS is calculated continuously — not just at month-end when it’s too late to act.

③ Gross Profit Margin

This is the most powerful number on this list. Gross Profit Margin tells you what percentage of every shilling of revenue you actually keep after covering the direct cost of your products. It’s the clearest measure of whether your pricing, purchasing, and product mix are working together.

Gross Margin % = ((Revenue − COGS) ÷ Revenue) × 100

Healthy gross margins vary by sector. A Nairobi supermarket might run at 18–25%. A restaurant can target 60–70% on food (before overheads). A bar with a strong house brand mix can push higher. The specific number matters less than knowing your number — and tracking whether it’s improving or eroding quarter by quarter.

“As SMEs look ahead to Q2, three imperatives emerge: protect cash flow by tightening receivables, managing inventory judiciously, and avoiding excessive debt.”

GoTyme Bank Business Banking Outlook, Q2 2026

④ Stock Turnover Rate

Dead stock is dead money. Every item sitting on your shelf that isn’t selling is cash you’ve already spent — cash that can’t pay rent, restock fast-moving items, or cover a surprise supplier invoice. Your Stock Turnover Rate shows you how efficiently you’re converting inventory into sales.

Stock Turnover = COGS ÷ Average Inventory Value

A higher turnover rate means your stock is moving quickly — you’re buying what sells. A low rate is a red flag: you may be over-ordering slow movers, or holding products that have quietly gone out of season while you were busy serving customers at the counter.

💡 PawaPOS tip: PawaPOS inventory alerts flag slow-moving stock before it becomes a write-off. You can set reorder levels per product and receive notifications when stock falls below your defined threshold — so you’re always stocking what sells, not what sits.

⑤ Average Transaction Value (ATV)

How much does the average customer spend per visit? This is your Average Transaction Value — and it’s one of the fastest levers you have to grow revenue without finding a single new customer.

ATV = Total Revenue ÷ Number of Transactions

If your ATV is KES 450 and you serve 80 customers a day, you’re generating KES 36,000 daily. Increasing ATV by just KES 50 — through a simple upsell, a bundled deal, or a well-placed impulse purchase at the counter — adds KES 4,000 per day without a single extra customer walking through the door. Over a month, that’s KES 100,000+ in additional revenue from one small change.

💡 PawaPOS tip: PawaPOS breaks down your transaction history by time of day, product category, and cashier — so you can spot exactly when and where upsell opportunities are being missed.


See Your Business Numbers in Real Time — Start Today

PawaPOS gives Kenyan SMEs a live dashboard with all five of these metrics tracked automatically — no Excel sheets, no end-of-month scrambles, no guessing. Whether you run a single shop or multiple branches, you’ll always know exactly where your business stands.


Why These Numbers Matter Even More in Q2 2026

This isn’t a normal Q2. Inflation has stabilised but input costs remain elevated for most retail and hospitality businesses across Kenya. Consumer spending is cautious. Credit is tighter. In this environment, the businesses that survive and grow won’t necessarily be the ones with the best products or the highest footfall — they’ll be the ones that make the best decisions with the data they have.

And you cannot make good decisions without good numbers.

Your April Action Plan: 3 Steps to Get Started This Week

  1. Pull your Q1 sales report and calculate your DSA, COGS, and Gross Margin for January, February, and March. Look for trends — not just totals.
  2. Identify your top 10 products by revenue and check their individual margins. You may find that your highest-selling product is also your lowest-margin one.
  3. Set a target for each of the 5 metrics for Q2 and review them weekly — not monthly. A week of bad numbers is recoverable. A quarter of ignored numbers is a crisis.

If you’re doing this manually right now, you already know how painful it is. PawaPOS was built specifically for Kenyan SMEs who are ready to stop guessing and start running their business on real data. See what PawaPOS can do for your business →

Final Thoughts

Five numbers. That’s all it takes to go from running your business on instinct to running it on intelligence. Your Daily Sales Average, Cost of Goods Sold, Gross Profit Margin, Stock Turnover Rate, and Average Transaction Value — tracked consistently, reviewed weekly, acted on quickly — are the difference between a business that grows and one that grinds.

Q2 has already started. The best time to get your numbers in order was January. The second-best time is today.

#image_title